 8
8peptides
spectra
0.000 | 0.000
0.000 | 0.000
0.000 | 0.000
0.165 | 0.287
0.222 | 0.359
0.000 | 0.000
0.281 | 0.315
0.153 | 0.186
| Plot | Mito | Lyso | Perox | ER | Golgi | PM | Cytosol | Nucleus | |||||
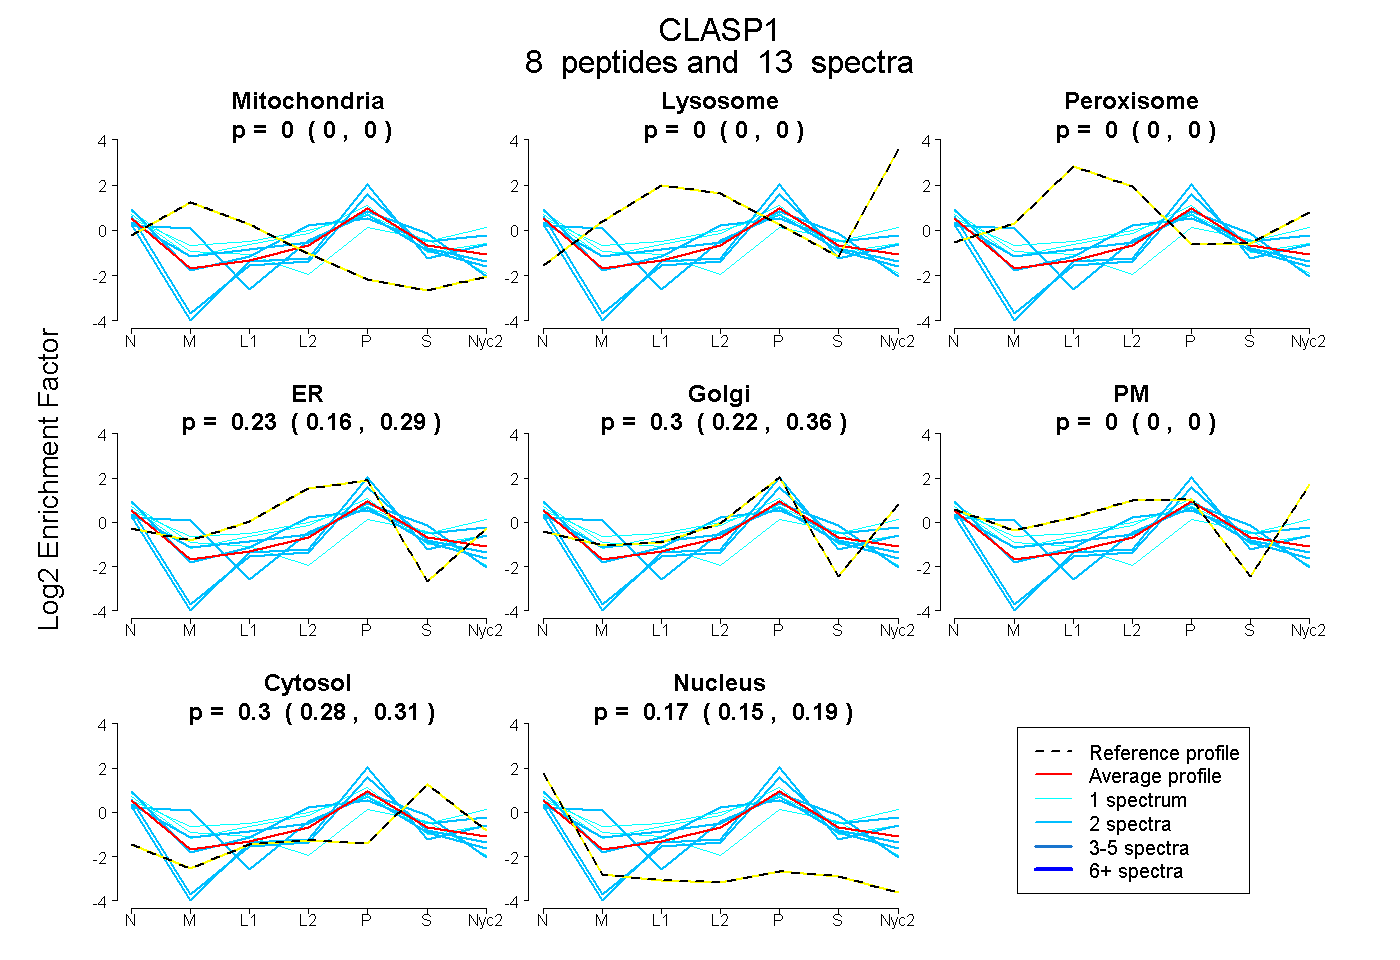
| Expt A |
8 peptides |
13 spectra |
|
0.000 0.000 | 0.000 |
0.000 0.000 | 0.000 |
0.000 0.000 | 0.000 |
0.231 0.165 | 0.287 |
0.298 0.222 | 0.359 |
0.000 0.000 | 0.000 |
0.299 0.281 | 0.315 |
0.171 0.153 | 0.186 |
| 2 spectra, VVSQSQPGSR | 0.000 | 0.000 | 0.000 | 0.000 | 0.599 | 0.000 | 0.230 | 0.172 | ||
| 2 spectra, SPTGSTASR | 0.000 | 0.000 | 0.000 | 0.000 | 0.474 | 0.000 | 0.282 | 0.244 | ||
| 2 spectra, GIHDADSEAR | 0.000 | 0.000 | 0.000 | 0.188 | 0.000 | 0.356 | 0.349 | 0.107 | ||
| 1 spectrum, EGAGAVDEEDFIK | 0.000 | 0.000 | 0.000 | 0.357 | 0.110 | 0.187 | 0.230 | 0.116 | ||
| 2 spectra, LLHNHLK | 0.005 | 0.000 | 0.000 | 0.452 | 0.000 | 0.000 | 0.390 | 0.153 | ||
| 1 spectrum, SADLEHDQTMLDK | 0.017 | 0.000 | 0.000 | 0.104 | 0.000 | 0.516 | 0.346 | 0.017 | ||
| 1 spectrum, EAVFDDDMEQLR | 0.168 | 0.000 | 0.000 | 0.000 | 0.280 | 0.000 | 0.307 | 0.245 | ||
| 2 spectra, IVPHICNLLGDPNSQVR | 0.130 | 0.000 | 0.000 | 0.146 | 0.341 | 0.000 | 0.200 | 0.183 |
| Plot | Mito | Lyso or Perox | ER | Golgi | PM | Cytosol | Nucleus | ||||||
| Expt B |
1 peptide |
1 spectrum |
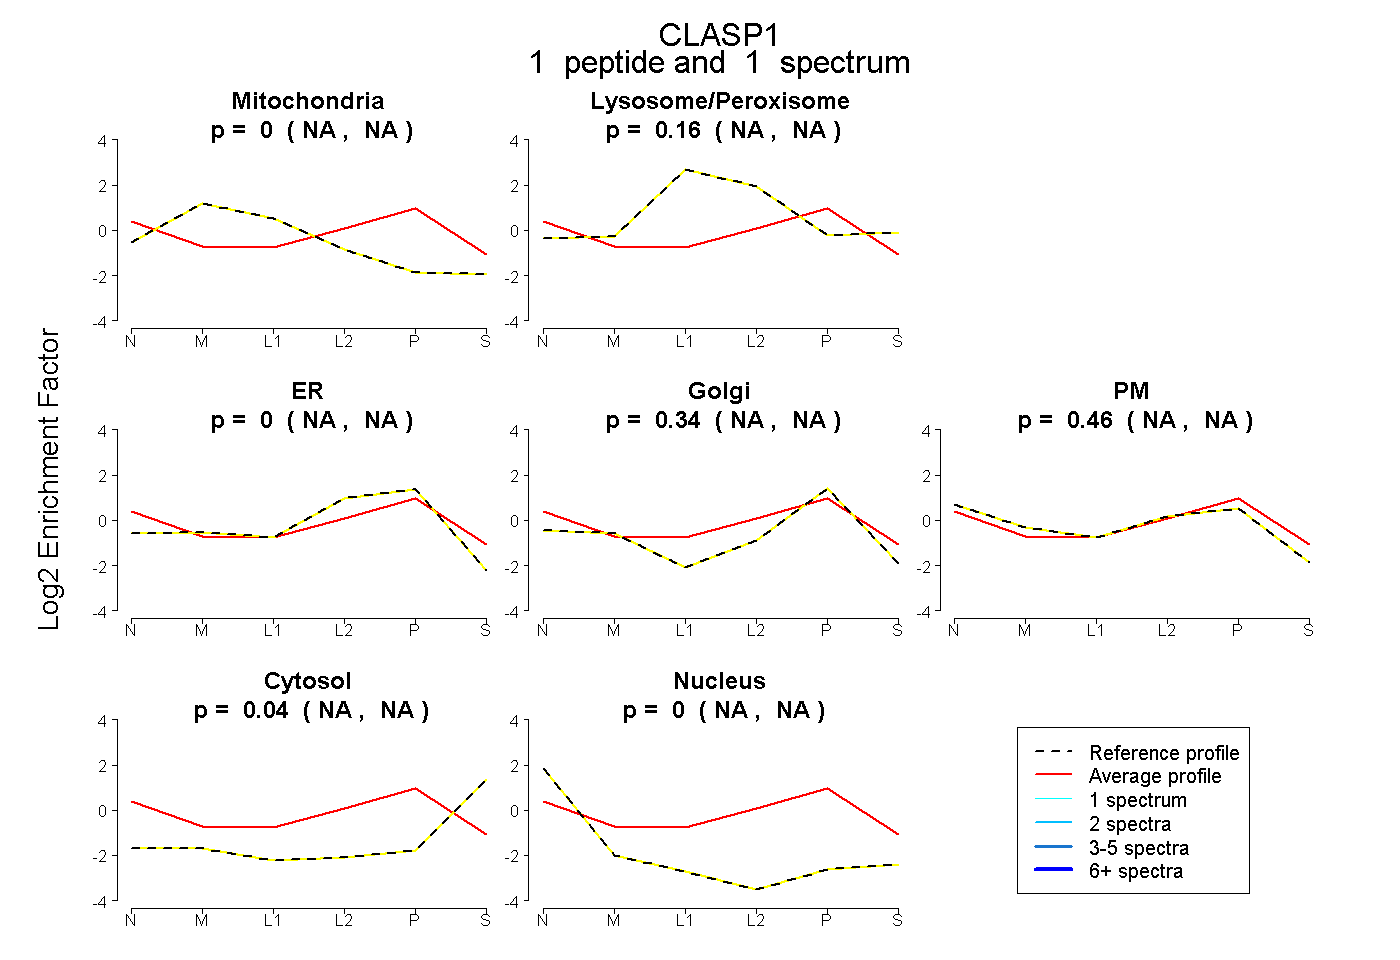 |
0.000 NA | NA |
0.164 NA | NA |
0.000 NA | NA |
0.340 NA | NA |
0.456 NA | NA |
0.039 NA | NA |
0.000 NA | NA |
|||
| Plot | Lyso | Other | |||||||||||
| Expt C |
3 peptides |
4 spectra |
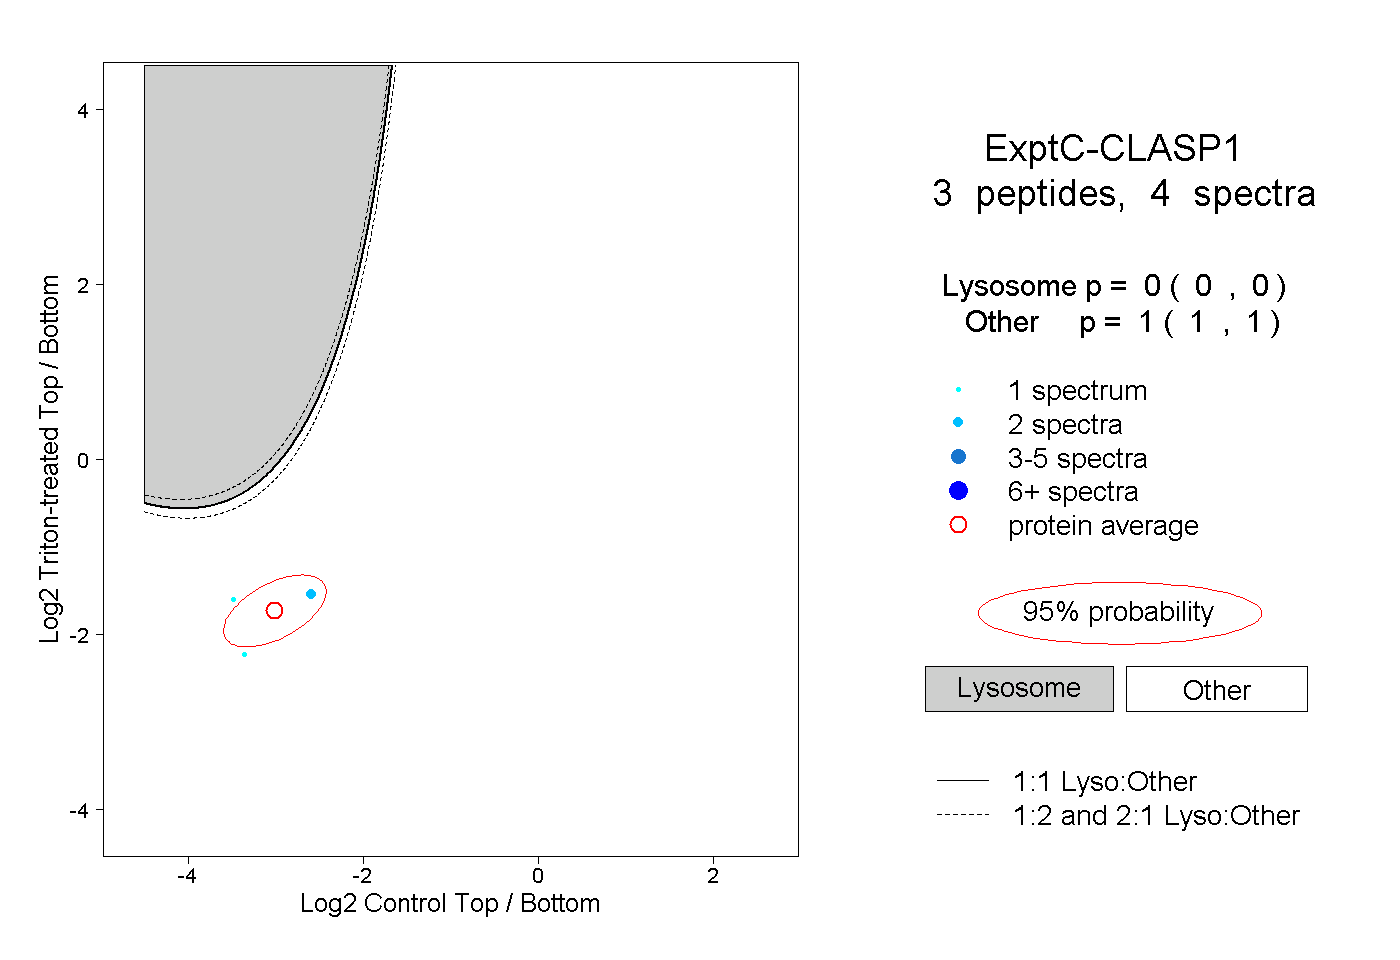 |
0.000 0.000 | 0.000 |
1.000 1.000 | 1.000 |
||||||||
| Plot | Lyso | Other | |||||||||||
| Expt D |
1 peptide |
1 spectrum |
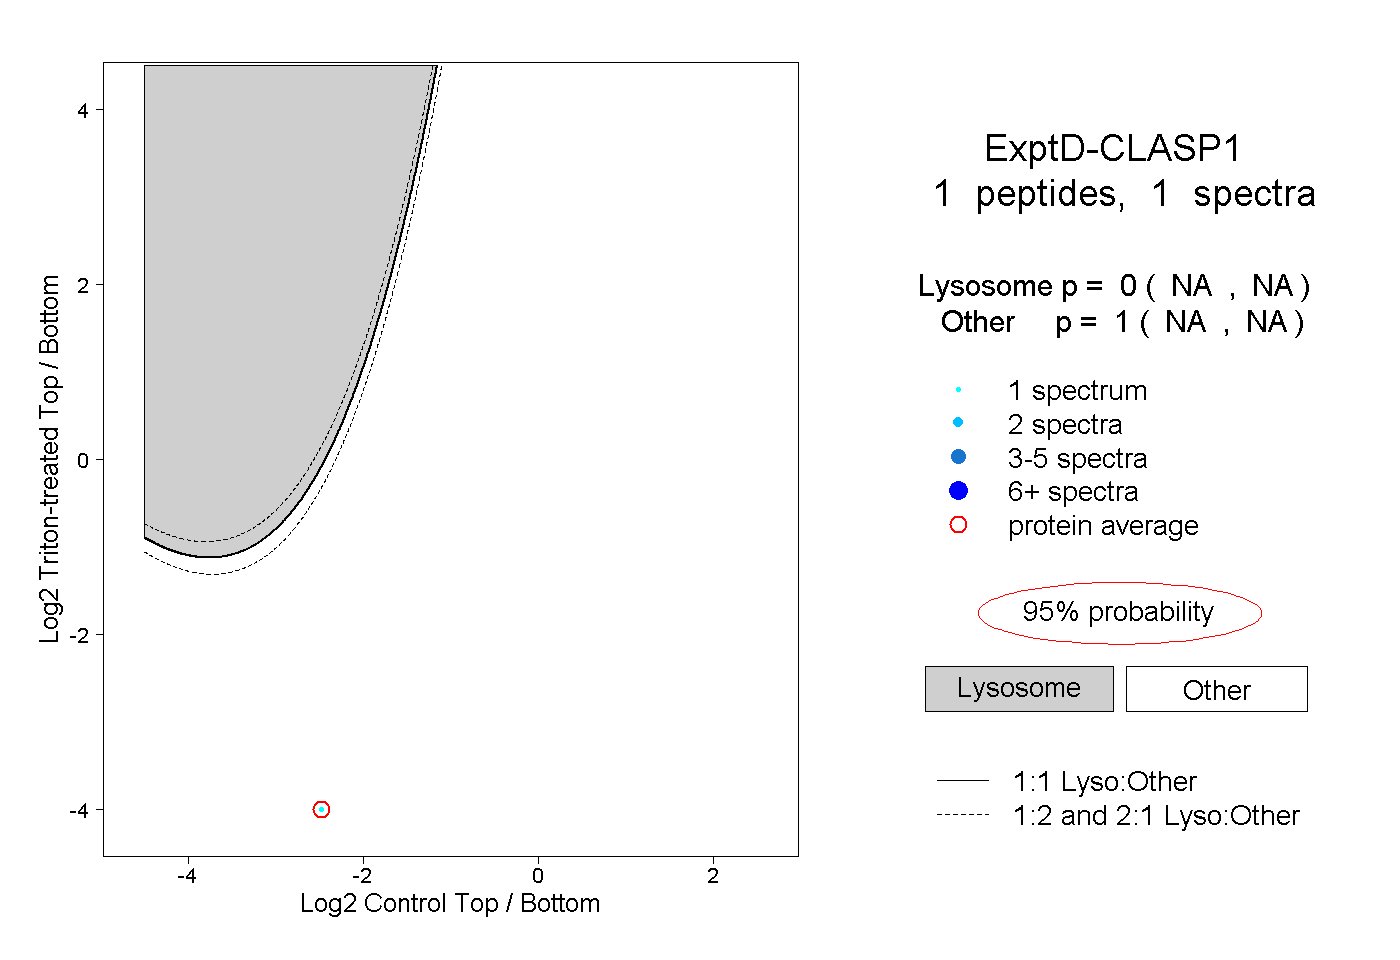 |
0.000 NA | NA |
1.000 NA | NA |