 4
4peptides
spectra
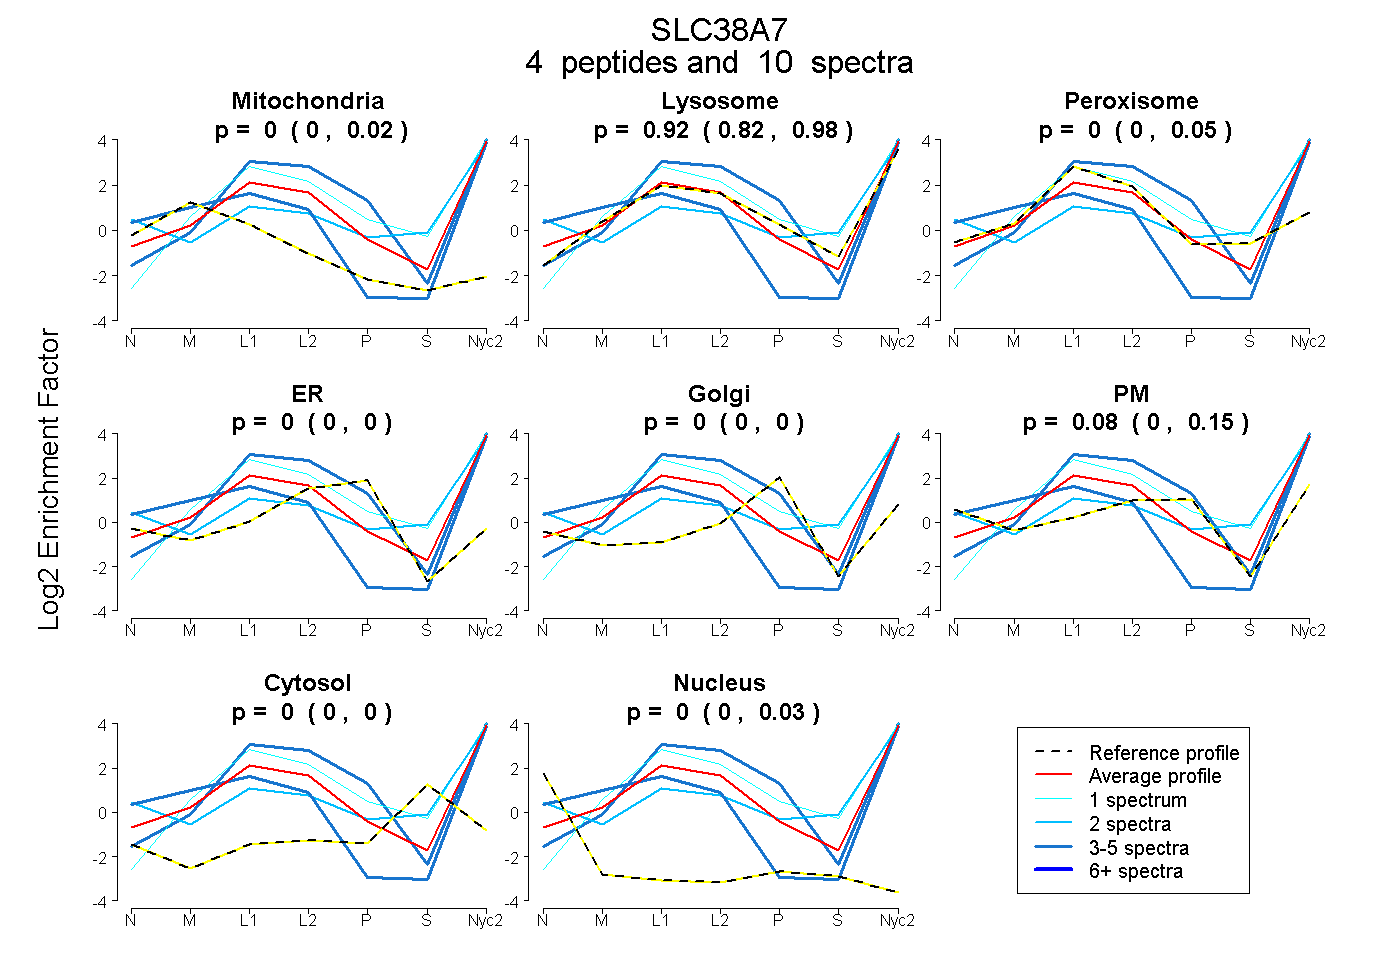
0.000 | 0.017
0.824 | 0.977
0.000 | 0.046
0.000 | 0.000
0.000 | 0.000
0.000 | 0.152
0.000 | 0.000
0.000 | 0.032
3peptides
spectra
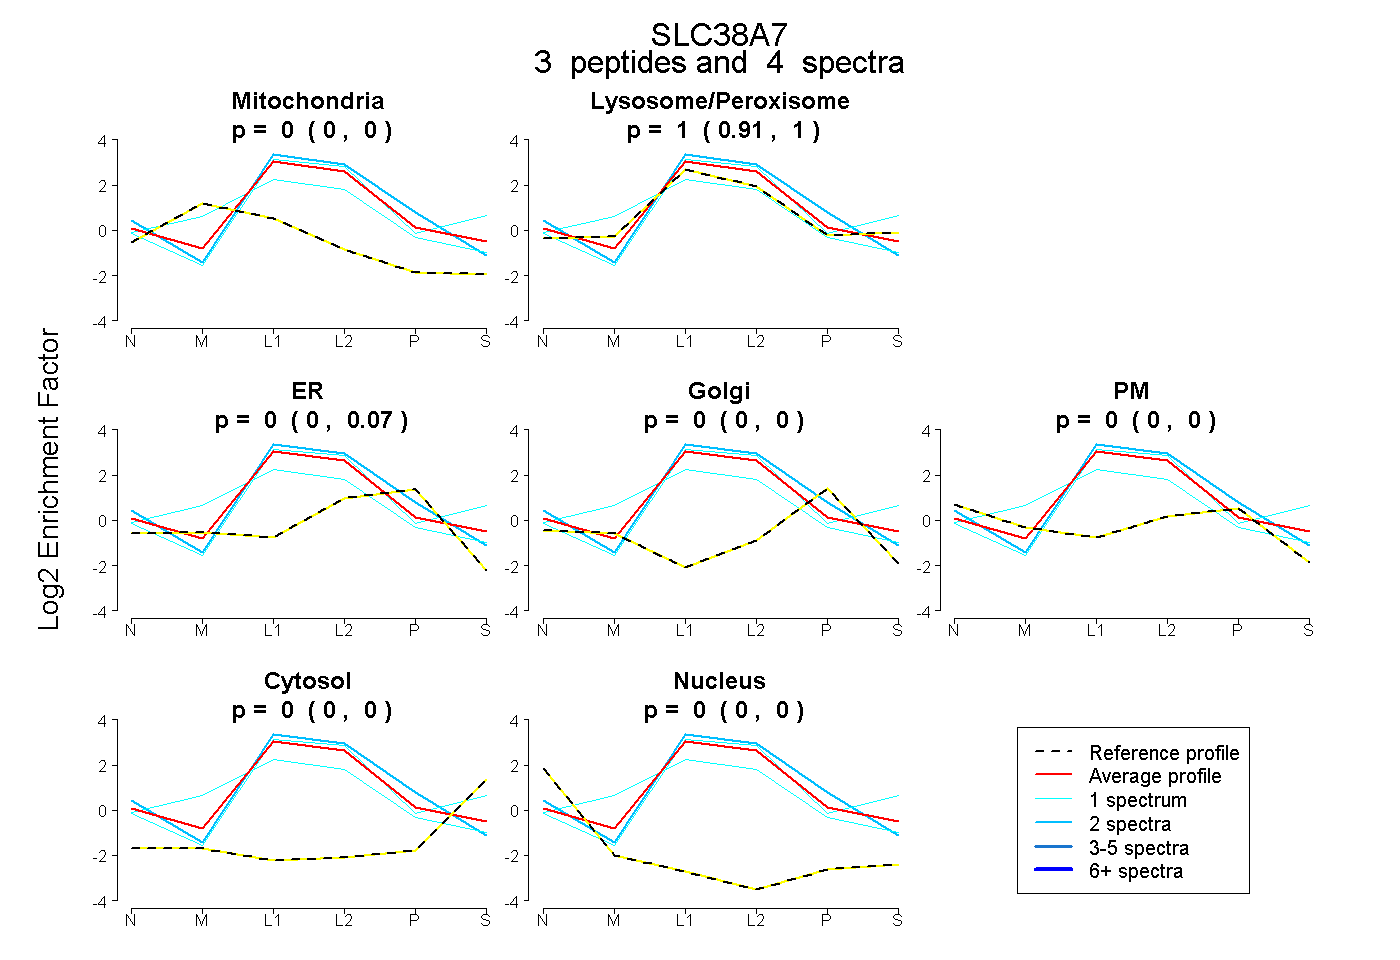
0.000 | 0.000
0.912 | 1.000
0.000 | 0.072
0.000 | 0.000
0.000 | 0.000
0.000 | 0.000
0.000 | 0.000
6peptides
spectra
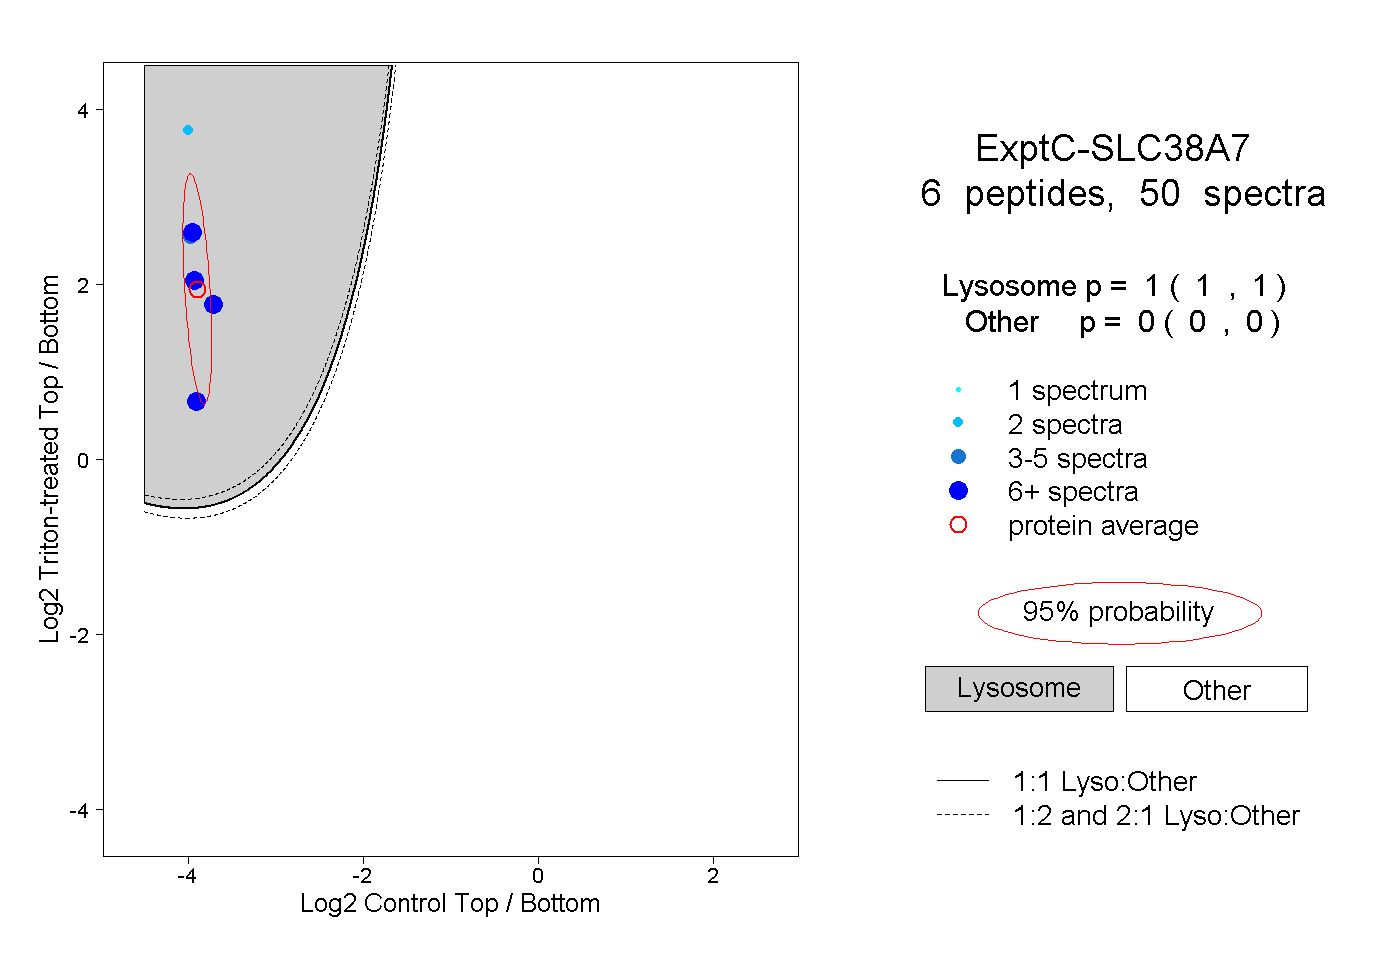
1.000 | 1.000
0.000 | 0.000
3peptides
spectra
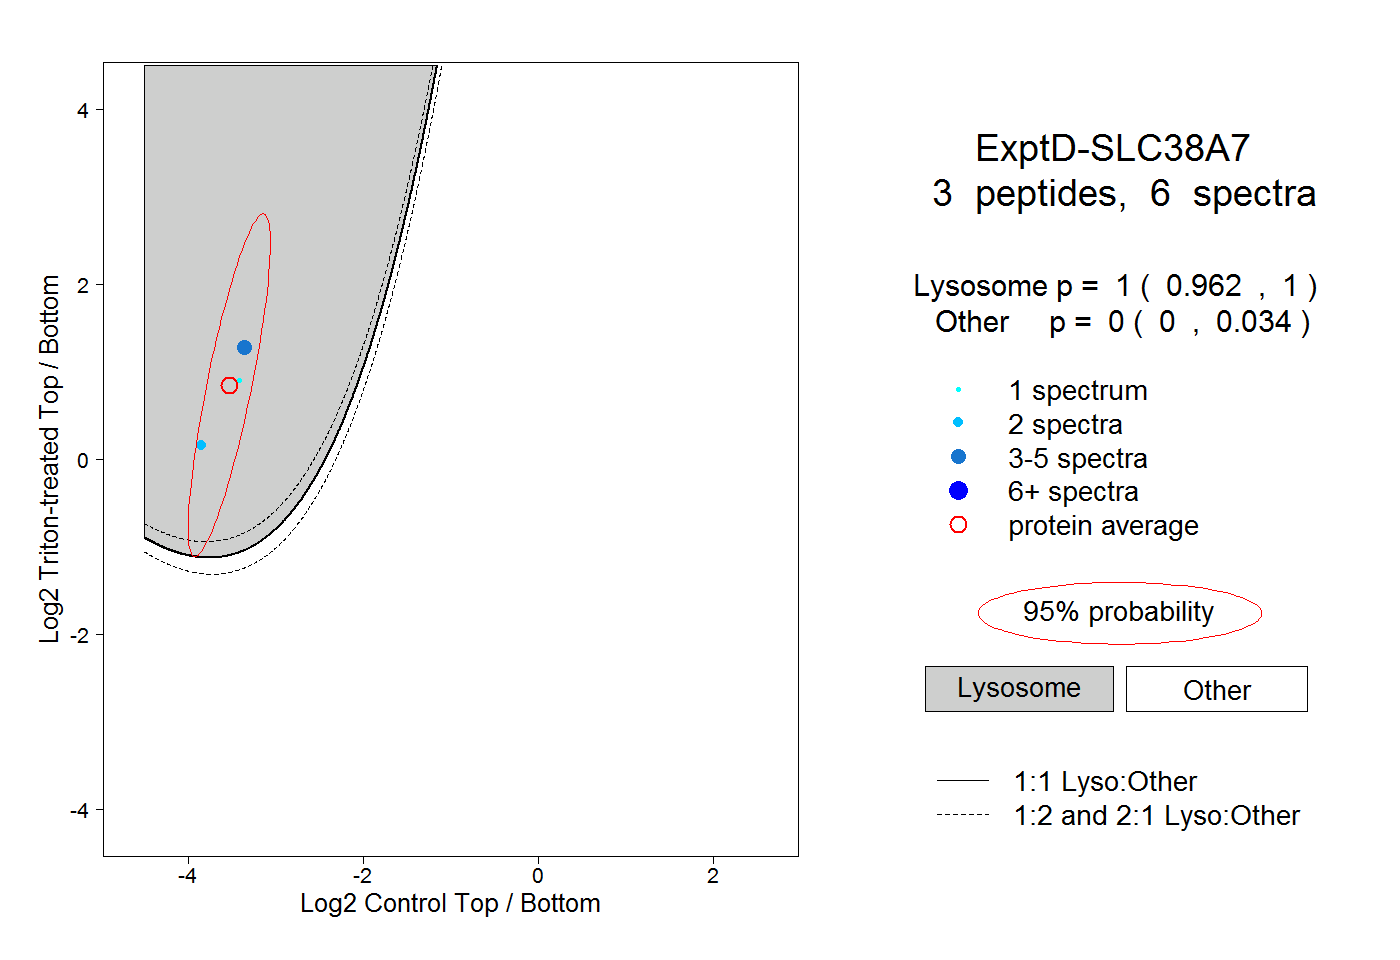
0.962 | 1.000
0.000 | 0.034