 1
1peptide
spectra
0.464 | 0.513
0.000 | 0.000
0.001 | 0.111
0.000 | 0.000
0.000 | 0.000
0.398 | 0.489
0.000 | 0.000
0.000 | 0.000
3peptides
spectra
0.000 | 0.000
1.000 | 1.000
| Plot | Mito | Lyso | Perox | ER | Golgi | PM | Cytosol | Nucleus | |||||
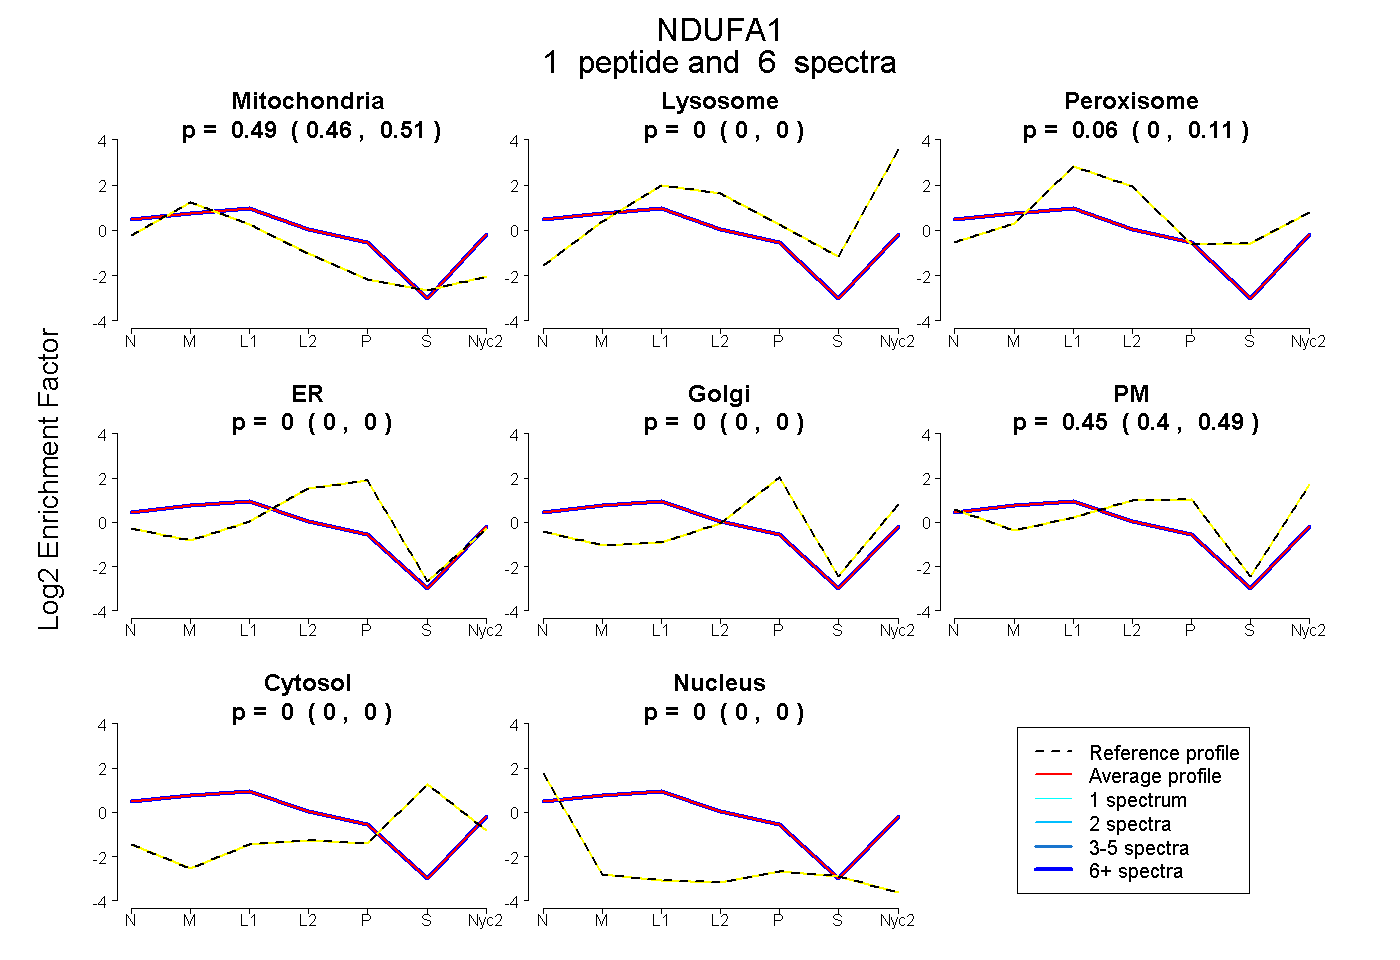
| Expt A |
1 peptide |
6 spectra |
|
0.491 0.464 | 0.513 |
0.000 0.000 | 0.000 |
0.060 0.001 | 0.111 |
0.000 0.000 | 0.000 |
0.000 0.000 | 0.000 |
0.449 0.398 | 0.489 |
0.000 0.000 | 0.000 |
0.000 0.000 | 0.000 |
||
| Plot | Lyso | Other | |||||||||||
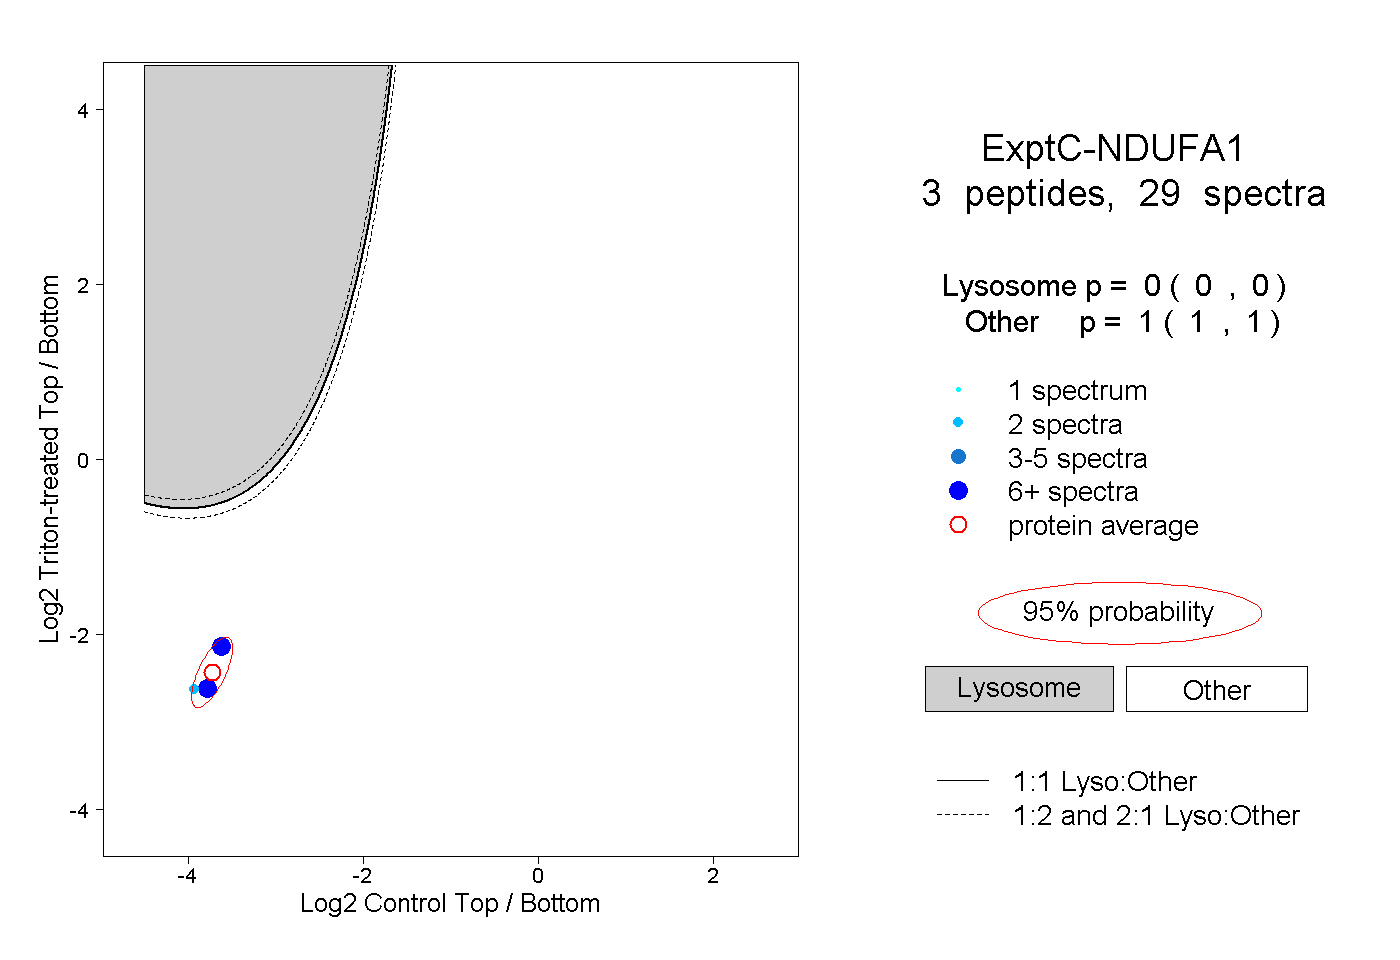
| Expt C |
3 peptides |
29 spectra |
|
0.000 0.000 | 0.000 |
1.000 1.000 | 1.000 |