 3
3peptides
spectra
0.000 | 0.000
0.000 | 0.000
0.000 | 0.009
0.470 | 0.683
0.000 | 0.104
0.000 | 0.162
0.214 | 0.266
0.016 | 0.061
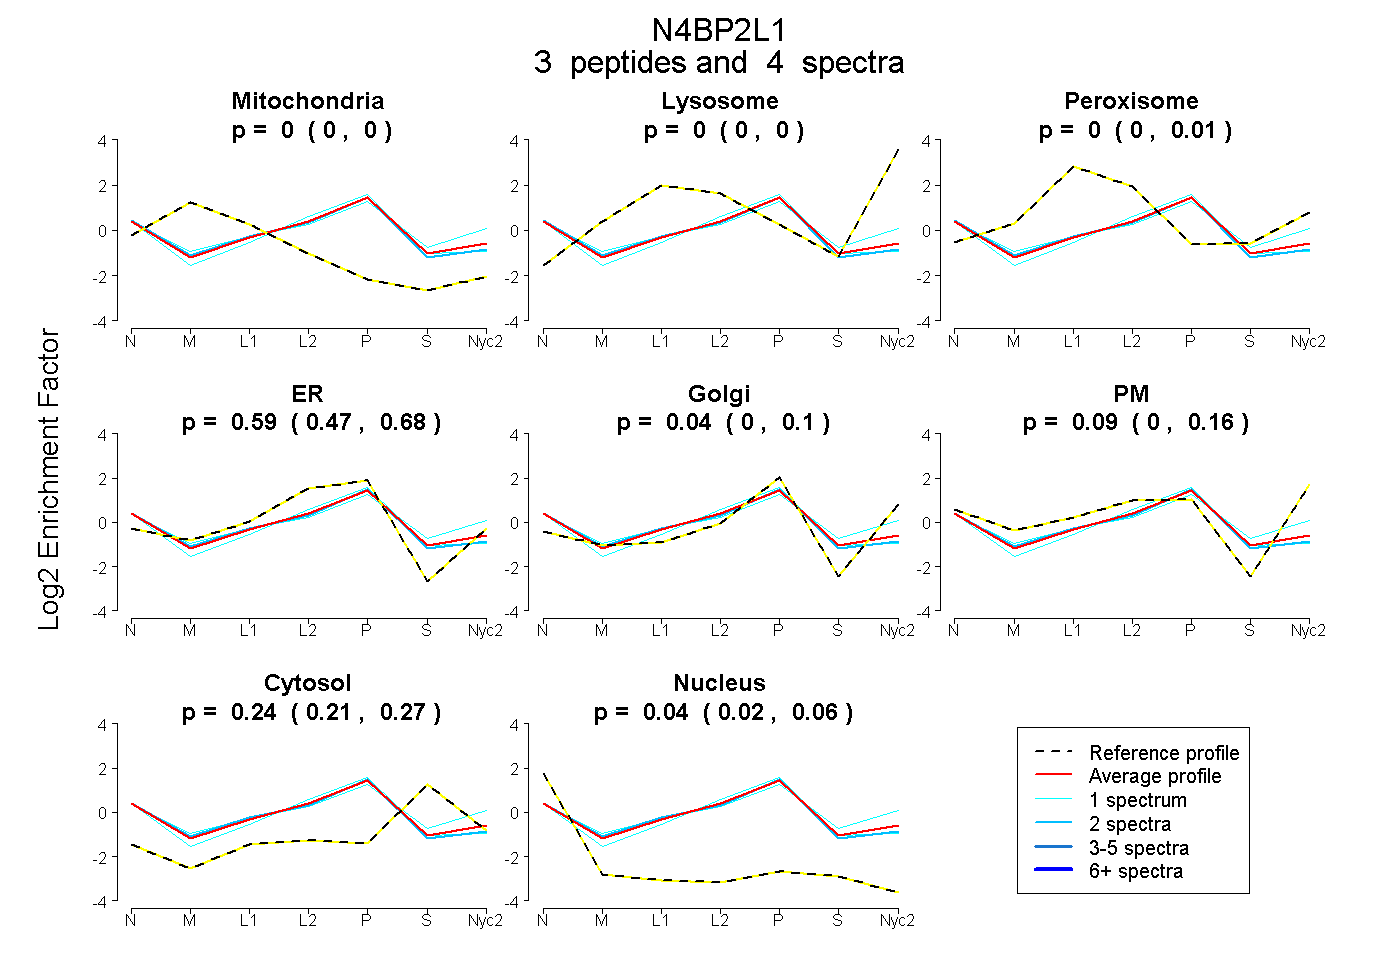
| Plot | Mito | Lyso | Perox | ER | Golgi | PM | Cytosol | Nucleus | |||||
| Expt A |
3 peptides |
4 spectra |
|
0.000 0.000 | 0.000 |
0.000 0.000 | 0.000 |
0.000 0.000 | 0.009 |
0.593 0.470 | 0.683 |
0.037 0.000 | 0.104 |
0.087 0.000 | 0.162 |
0.244 0.214 | 0.266 |
0.039 0.016 | 0.061 |
| 1 spectrum, FNVQELAR | 0.000 | 0.000 | 0.017 | 0.281 | 0.106 | 0.313 | 0.284 | 0.000 | ||
| 1 spectrum, HLYLLR | 0.000 | 0.000 | 0.000 | 0.702 | 0.000 | 0.000 | 0.241 | 0.058 | ||
| 2 spectra, QQQPPPRPLPAR | 0.000 | 0.000 | 0.022 | 0.668 | 0.040 | 0.000 | 0.196 | 0.074 |