 2
2peptides
spectra
0.000 | 0.000
0.000 | 0.000
0.218 | 0.257
0.141 | 0.164
0.000 | 0.000
0.000 | 0.000
0.388 | 0.434
0.179 | 0.208
1peptide
spectra
0.000 | 0.000
1.000 | 1.000
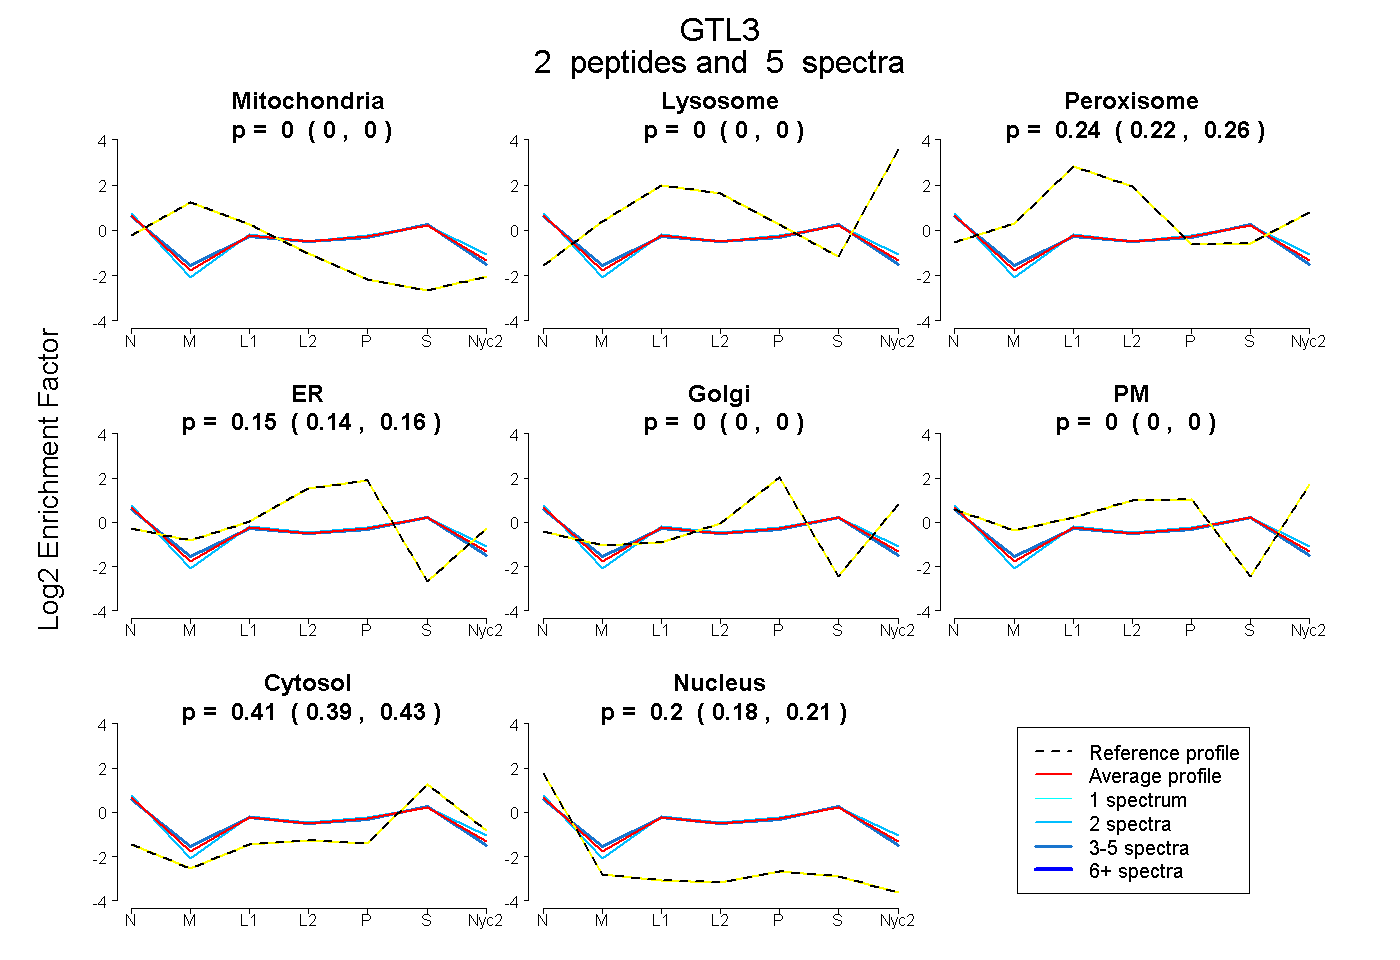
| Plot | Mito | Lyso | Perox | ER | Golgi | PM | Cytosol | Nucleus | |||||
| Expt A |
2 peptides |
5 spectra |
|
0.000 0.000 | 0.000 |
0.000 0.000 | 0.000 |
0.239 0.218 | 0.257 |
0.153 0.141 | 0.164 |
0.000 0.000 | 0.000 |
0.000 0.000 | 0.000 |
0.412 0.388 | 0.434 |
0.195 0.179 | 0.208 |
||
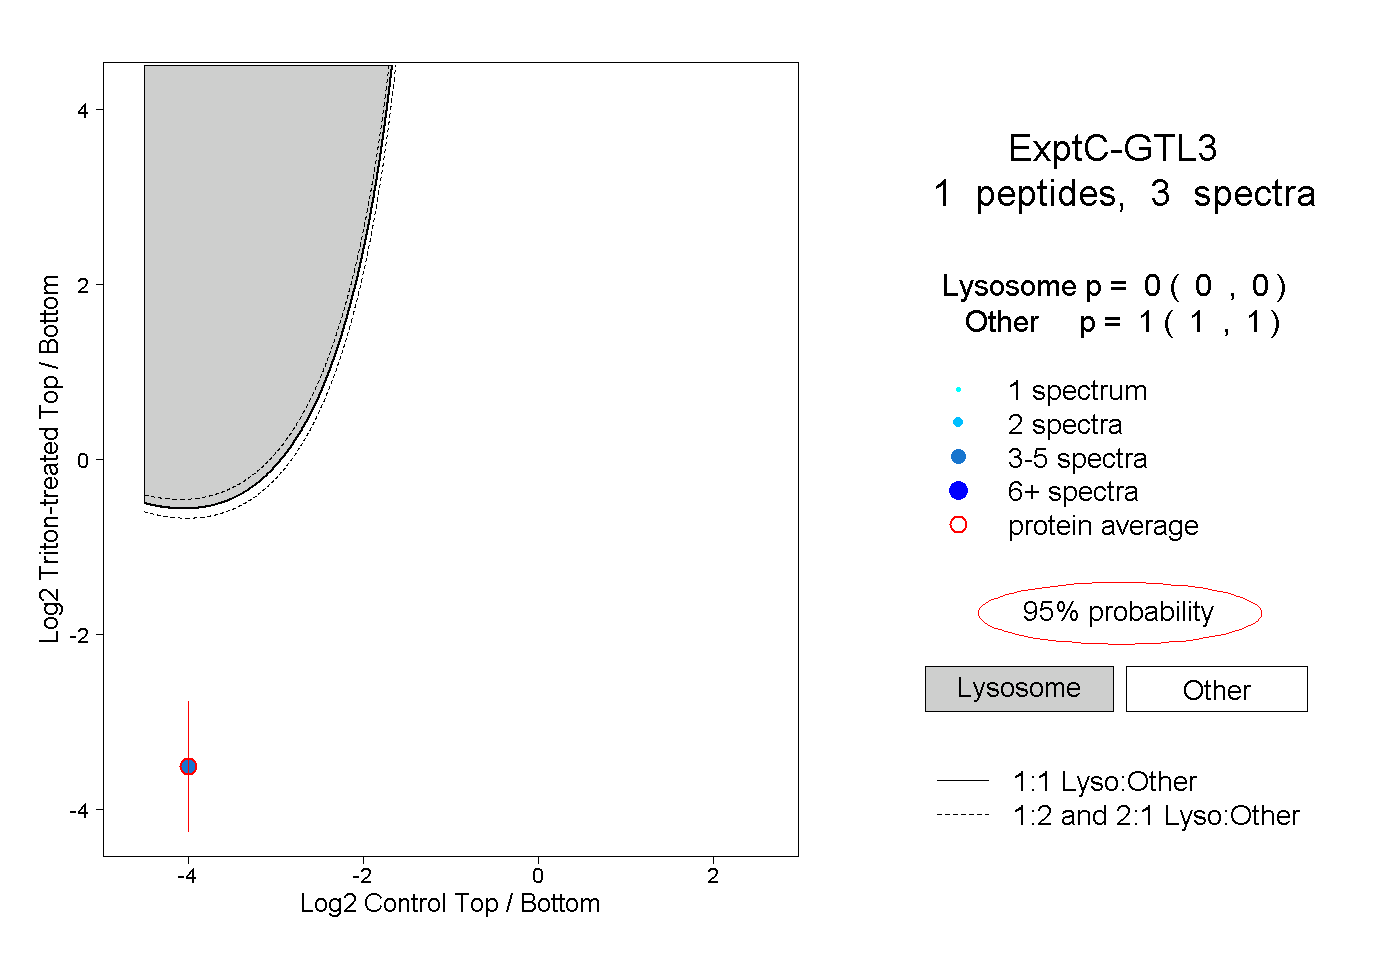
| Plot | Lyso | Other | |||||||||||
| Expt C |
1 peptide |
3 spectra |
|
0.000 0.000 | 0.000 |
1.000 1.000 | 1.000 |