 3
3peptides
spectra
0.000 | 0.000
0.000 | 0.000
0.000 | 0.225
0.188 | 0.548
0.000 | 0.000
0.000 | 0.188
0.052 | 0.230
0.195 | 0.388
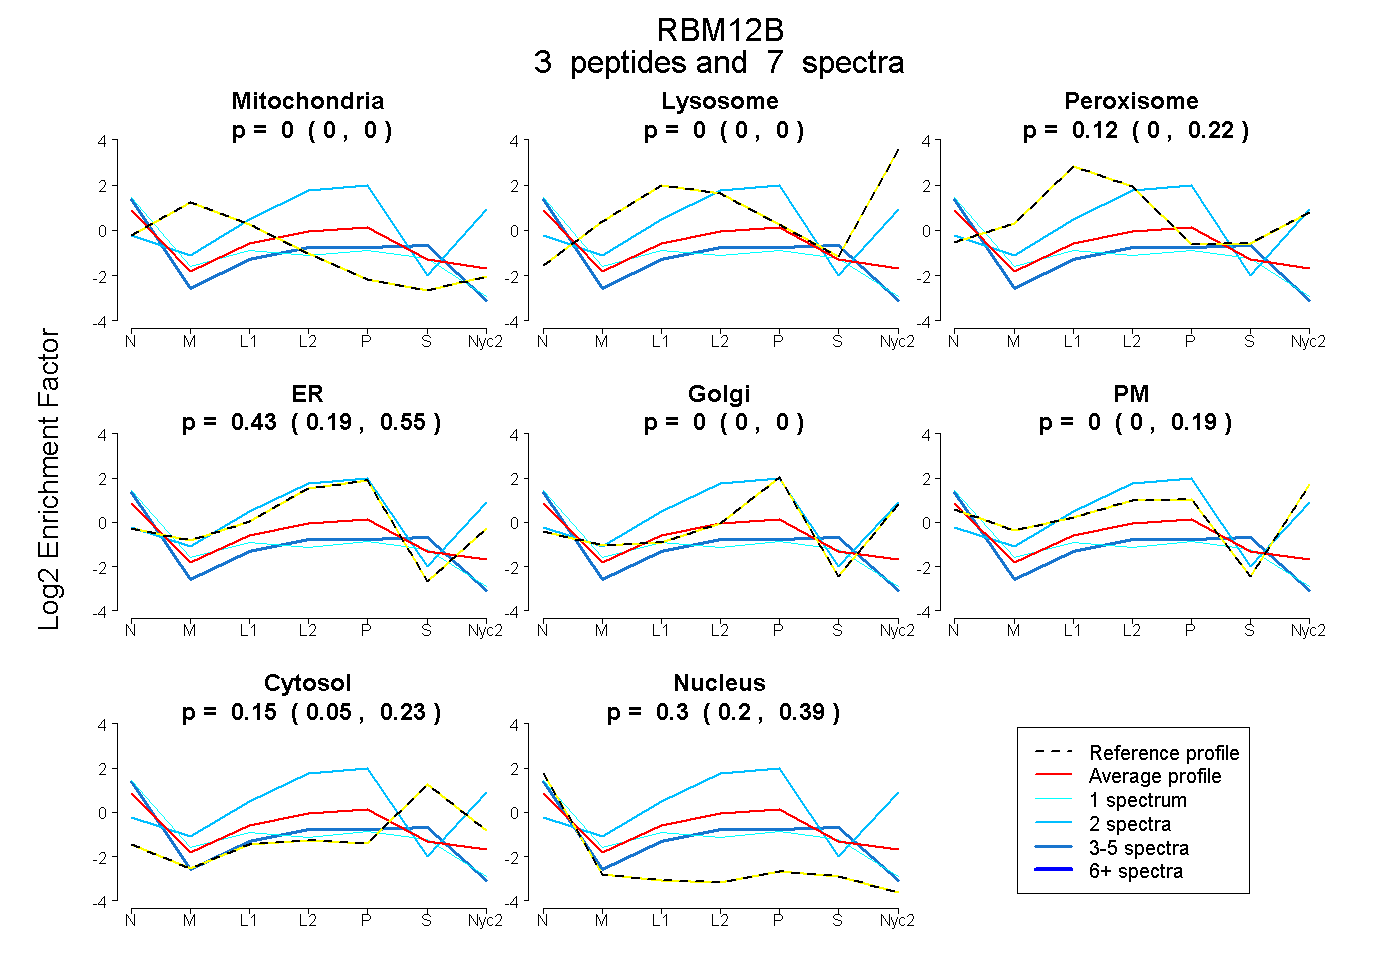
| Plot | Mito | Lyso | Perox | ER | Golgi | PM | Cytosol | Nucleus | |||||
| Expt A |
3 peptides |
7 spectra |
|
0.000 0.000 | 0.000 |
0.000 0.000 | 0.000 |
0.120 0.000 | 0.225 |
0.428 0.188 | 0.548 |
0.000 0.000 | 0.000 |
0.000 0.000 | 0.188 |
0.151 0.052 | 0.230 |
0.302 0.195 | 0.388 |
| 2 spectra, SGGLLR | 0.000 | 0.191 | 0.000 | 0.698 | 0.028 | 0.083 | 0.000 | 0.000 | ||
| 1 spectrum, TVLQYRPVLIDPISR | 0.000 | 0.000 | 0.239 | 0.131 | 0.000 | 0.000 | 0.058 | 0.572 | ||
| 4 spectra, HVADEDFR | 0.000 | 0.000 | 0.066 | 0.200 | 0.000 | 0.000 | 0.252 | 0.482 |