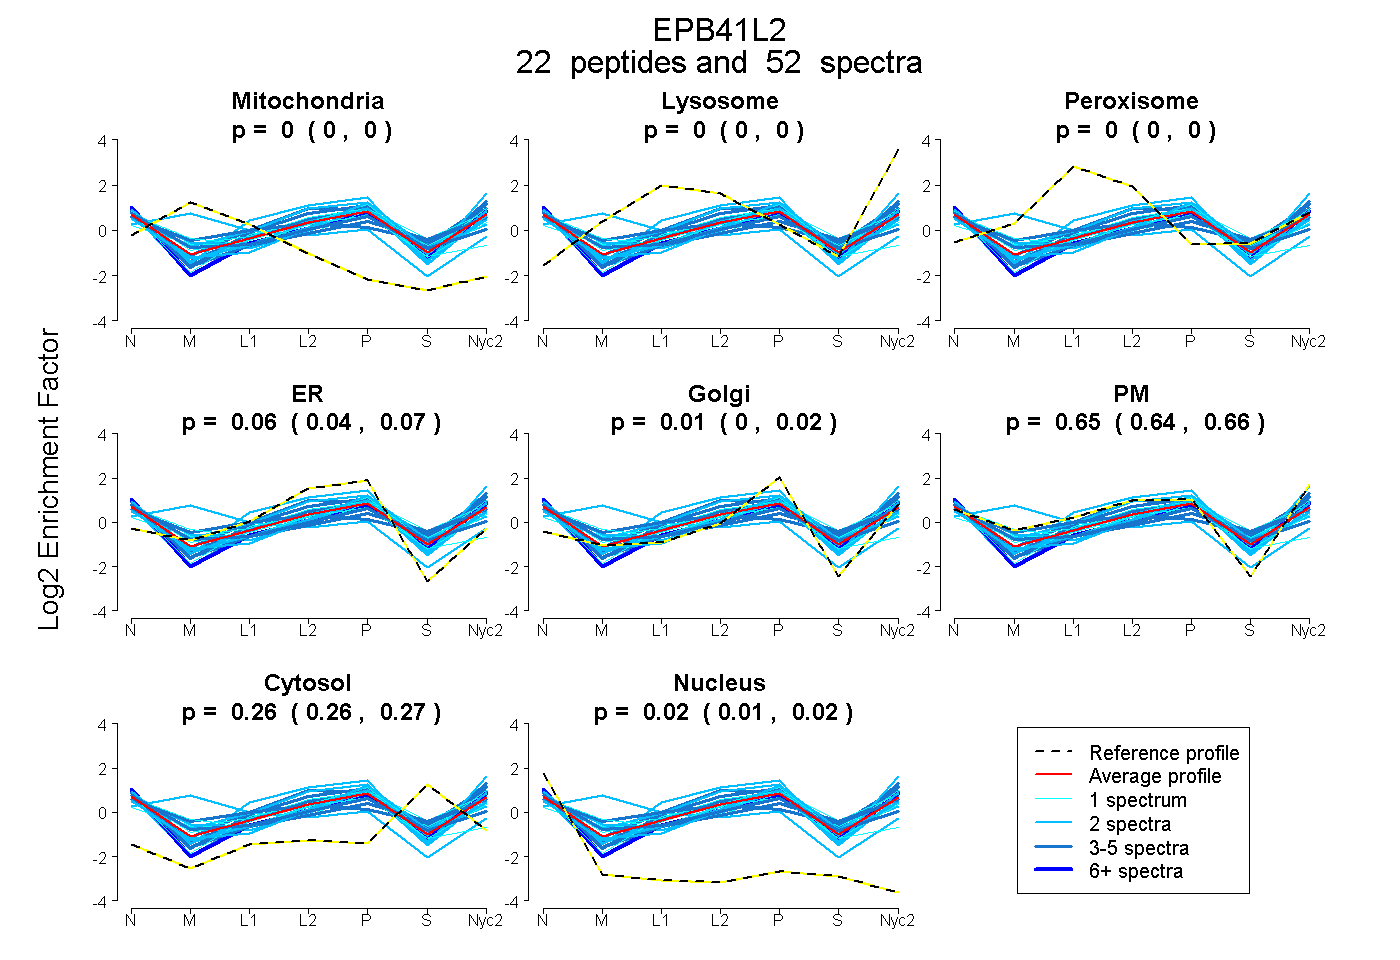
 22
22peptides
spectra
0.000 | 0.000
0.000 | 0.000
0.000 | 0.000
0.042 | 0.066
0.000 | 0.022
0.643 | 0.663
0.258 | 0.266
0.015 | 0.021
| Plot | Mito | Lyso | Perox | ER | Golgi | PM | Cytosol | Nucleus | |||||
| Expt A |
22 peptides |
52 spectra |
|
0.000 0.000 | 0.000 |
0.000 0.000 | 0.000 |
0.000 0.000 | 0.000 |
0.055 0.042 | 0.066 |
0.011 0.000 | 0.022 |
0.653 0.643 | 0.663 |
0.262 0.258 | 0.266 |
0.018 0.015 | 0.021 |
| 1 spectrum, VRPGELEQFESTIGFK | 0.000 | 0.000 | 0.000 | 0.147 | 0.000 | 0.587 | 0.201 | 0.065 | ||
| 6 spectra, GGISETR | 0.000 | 0.000 | 0.000 | 0.000 | 0.111 | 0.592 | 0.215 | 0.082 | ||
| 2 spectra, VAEIHK | 0.000 | 0.000 | 0.000 | 0.000 | 0.230 | 0.532 | 0.132 | 0.106 | ||
| 2 spectra, GSDPSGADAHK | 0.000 | 0.057 | 0.000 | 0.096 | 0.000 | 0.748 | 0.099 | 0.000 | ||
| 3 spectra, EAAMPEAIPDR | 0.000 | 0.000 | 0.000 | 0.000 | 0.000 | 0.693 | 0.307 | 0.000 | ||
| 2 spectra, GDAEEMAQR | 0.000 | 0.000 | 0.000 | 0.030 | 0.054 | 0.625 | 0.290 | 0.000 | ||
| 2 spectra, ELSPGSGPGETR | 0.000 | 0.000 | 0.000 | 0.000 | 0.074 | 0.599 | 0.327 | 0.000 | ||
| 4 spectra, EQHPDMSVTR | 0.000 | 0.000 | 0.085 | 0.060 | 0.000 | 0.623 | 0.233 | 0.000 | ||
| 2 spectra, FYPPDPSQLTEDITR | 0.000 | 0.000 | 0.000 | 0.000 | 0.085 | 0.608 | 0.219 | 0.088 | ||
| 1 spectrum, LSMYGVDLHHAK | 0.000 | 0.000 | 0.108 | 0.007 | 0.114 | 0.501 | 0.270 | 0.000 | ||
| 3 spectra, FIPPWLK | 0.000 | 0.000 | 0.000 | 0.000 | 0.000 | 0.774 | 0.226 | 0.000 | ||
| 3 spectra, SSAEIQPAEQVR | 0.000 | 0.000 | 0.000 | 0.000 | 0.000 | 0.571 | 0.388 | 0.042 | ||
| 2 spectra, GQALFDR | 0.456 | 0.000 | 0.026 | 0.000 | 0.194 | 0.323 | 0.000 | 0.000 | ||
| 1 spectrum, VCEHLNLLEK | 0.113 | 0.000 | 0.000 | 0.365 | 0.000 | 0.259 | 0.182 | 0.080 | ||
| 2 spectra, NWLDPAK | 0.000 | 0.000 | 0.000 | 0.000 | 0.118 | 0.680 | 0.160 | 0.041 | ||
| 2 spectra, SNFYLK | 0.000 | 0.000 | 0.040 | 0.328 | 0.000 | 0.476 | 0.156 | 0.000 | ||
| 2 spectra, VDGDNIYVR | 0.000 | 0.000 | 0.000 | 0.126 | 0.239 | 0.341 | 0.281 | 0.013 | ||
| 4 spectra, FLTLGSK | 0.000 | 0.000 | 0.000 | 0.000 | 0.021 | 0.759 | 0.209 | 0.010 | ||
| 3 spectra, VTLLDGTEFSCDLEK | 0.000 | 0.000 | 0.000 | 0.105 | 0.000 | 0.539 | 0.275 | 0.081 | ||
| 1 spectrum, SYSLVVAK | 0.000 | 0.000 | 0.000 | 0.000 | 0.120 | 0.615 | 0.265 | 0.000 | ||
| 3 spectra, TEMVTISDASQR | 0.000 | 0.000 | 0.187 | 0.000 | 0.000 | 0.508 | 0.272 | 0.033 | ||
| 1 spectrum, GLSPAQADSQFLENAK | 0.000 | 0.000 | 0.000 | 0.000 | 0.160 | 0.530 | 0.309 | 0.001 |
| Plot | Mito | Lyso or Perox | ER | Golgi | PM | Cytosol | Nucleus | ||||||
| Expt B |
2 peptides |
2 spectra |
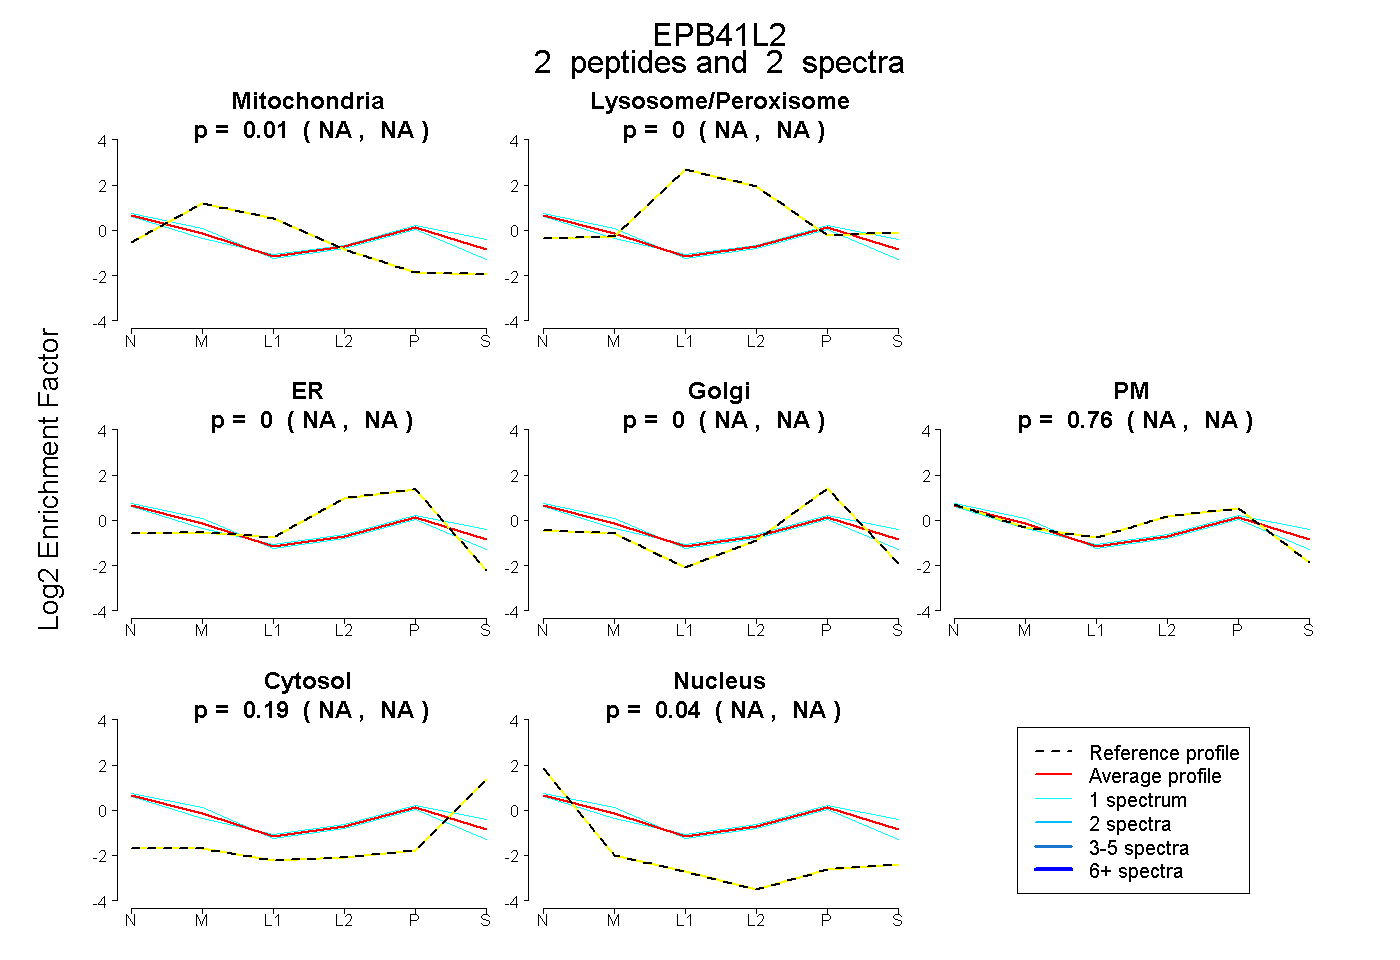 |
0.012 NA | NA |
0.000 NA | NA |
0.000 NA | NA |
0.000 NA | NA |
0.757 NA | NA |
0.195 NA | NA |
0.036 NA | NA |
|||
| Plot | Lyso | Other | |||||||||||
| Expt C |
25 peptides |
66 spectra |
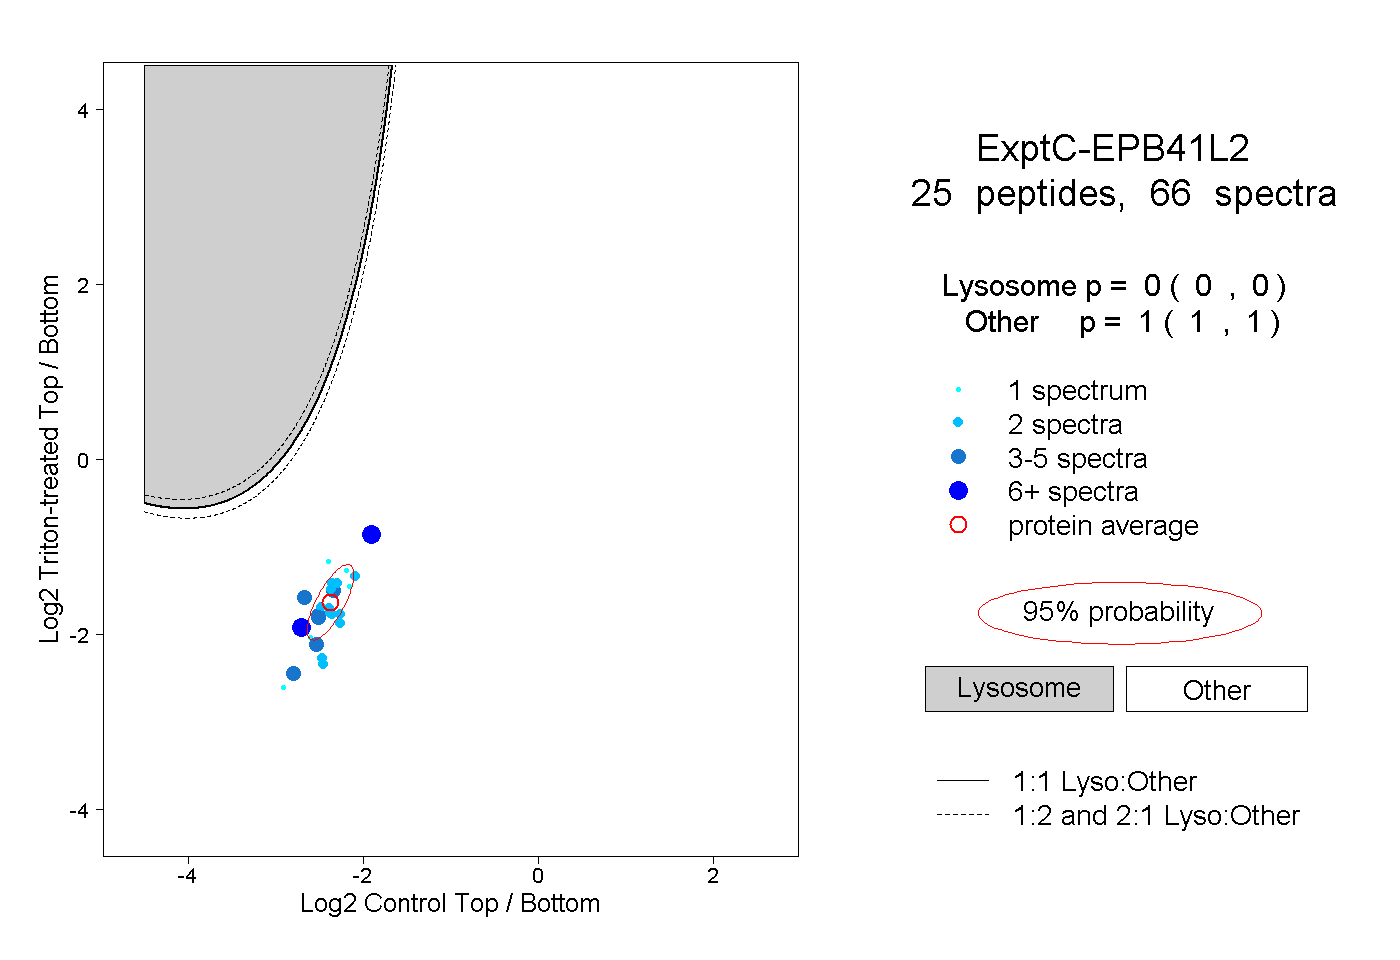 |
0.000 0.000 | 0.000 |
1.000 1.000 | 1.000 |
||||||||
| Plot | Lyso | Other | |||||||||||
| Expt D |
3 peptides |
5 spectra |
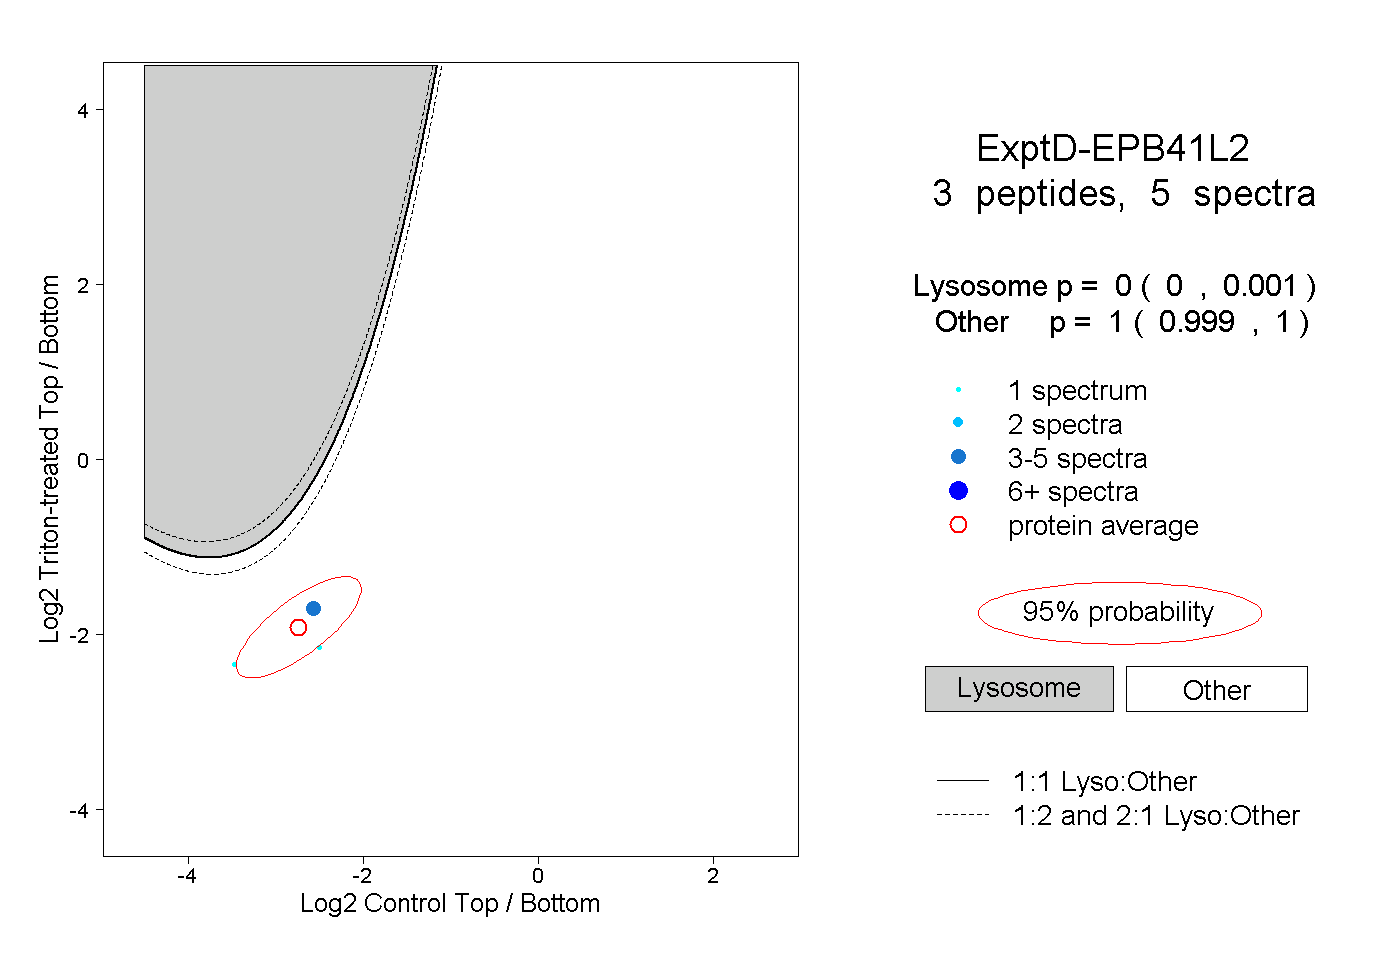 |
0.000 0.000 | 0.001 |
1.000 0.999 | 1.000 |