13
13peptides
spectra
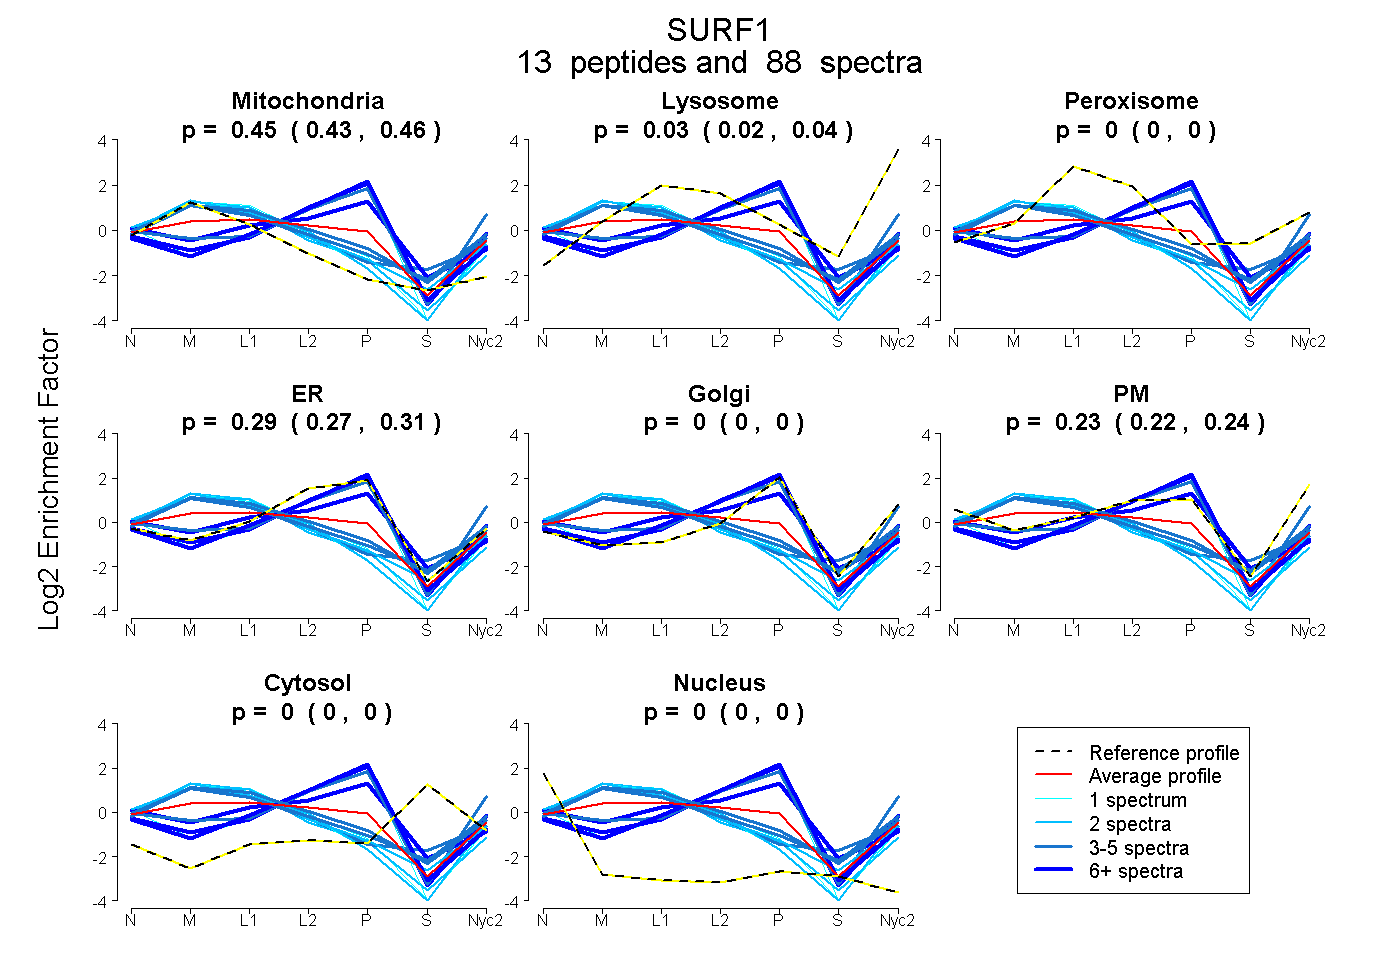
0.433 | 0.458
0.022 | 0.037
0.000 | 0.000
0.270 | 0.309
0.000 | 0.000
0.219 | 0.243
0.000 | 0.000
0.000 | 0.000
2peptides
spectra
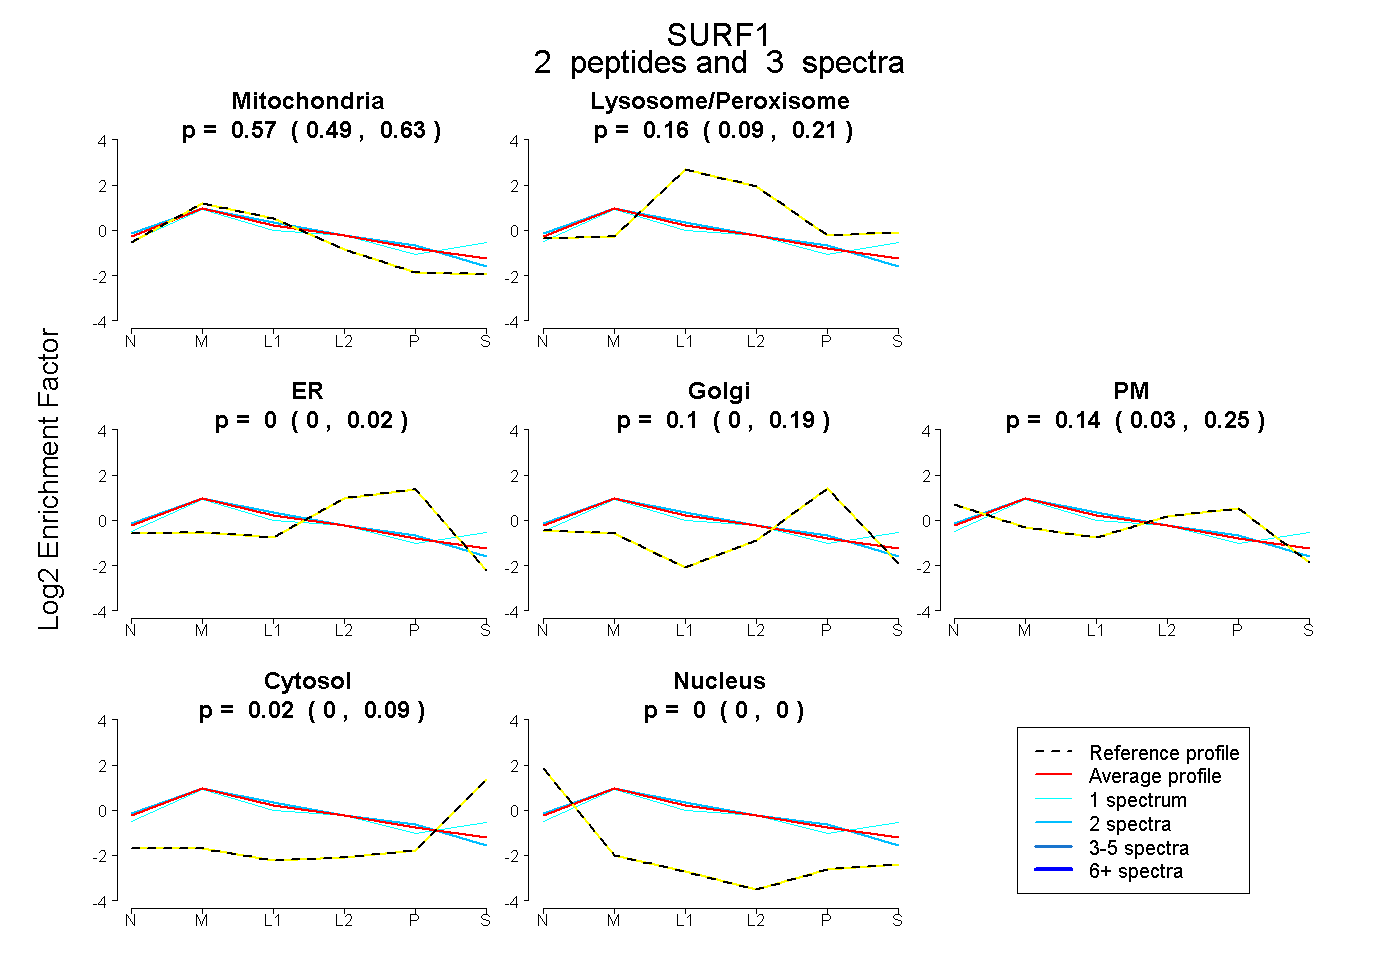
0.485 | 0.626
0.087 | 0.210
0.000 | 0.024
0.000 | 0.194
0.029 | 0.247
0.000 | 0.087
0.000 | 0.000
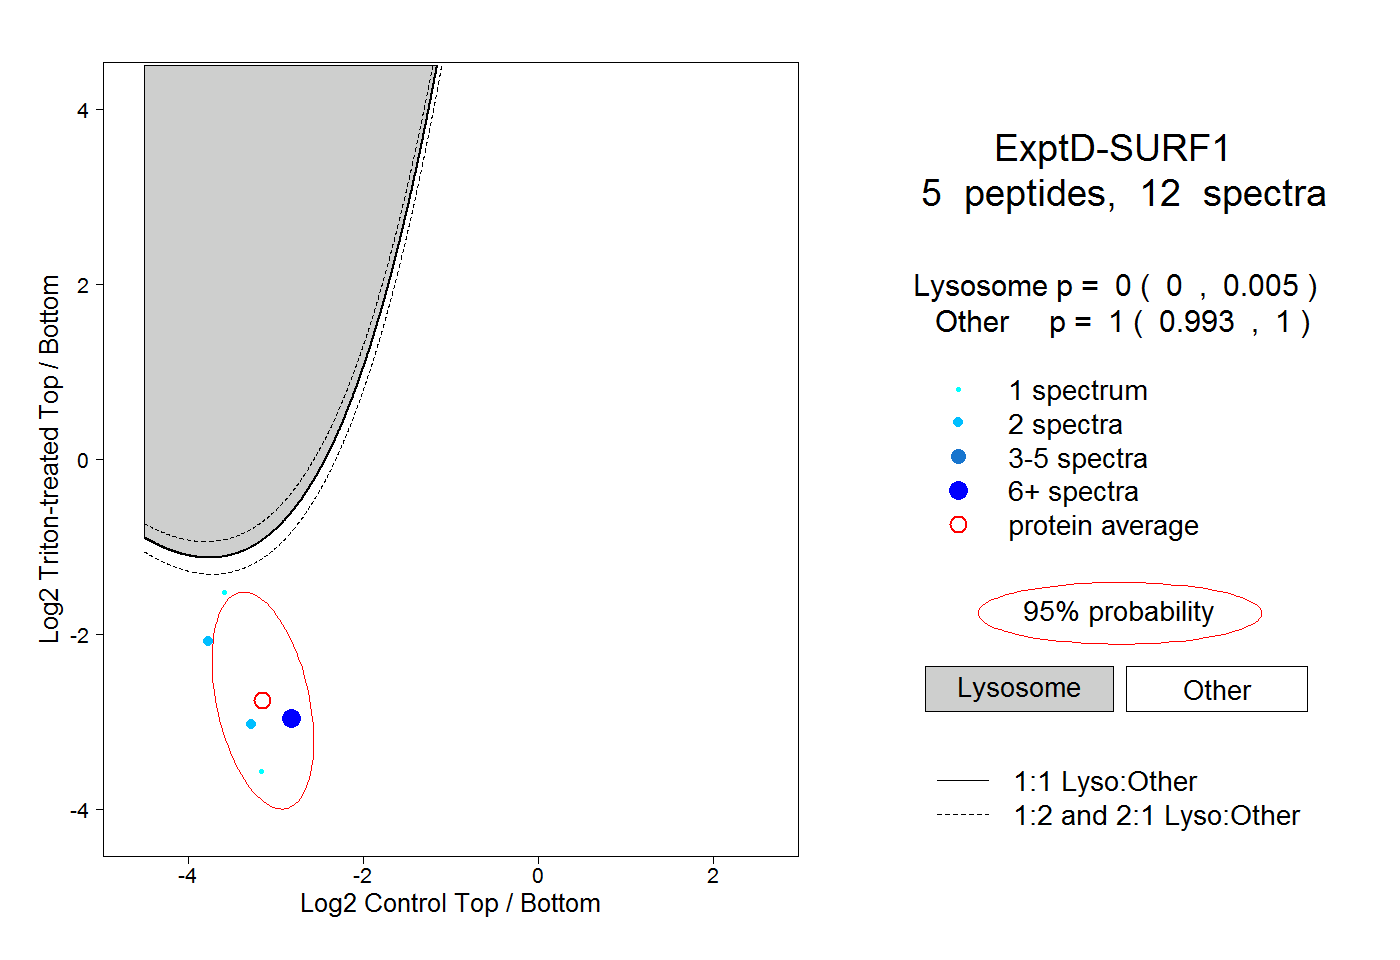
18peptides
spectra
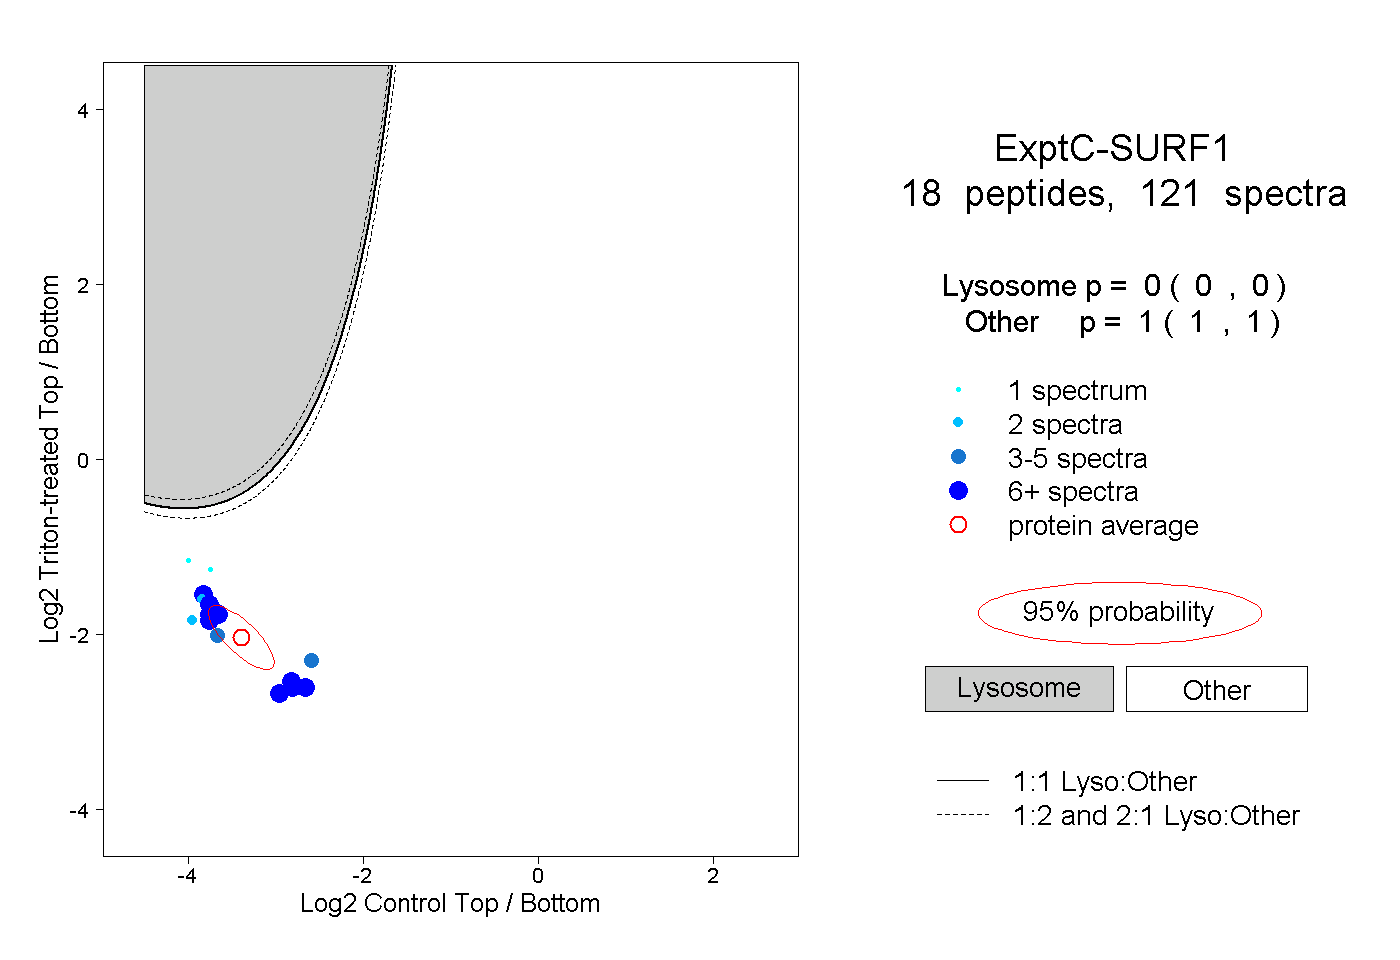
0.000 | 0.000
1.000 | 1.000