 13
13peptides
spectra
0.433 | 0.458
0.022 | 0.037
0.000 | 0.000
0.270 | 0.309
0.000 | 0.000
0.219 | 0.243
0.000 | 0.000
0.000 | 0.000
| Plot | Mito | Lyso | Perox | ER | Golgi | PM | Cytosol | Nucleus | |||||
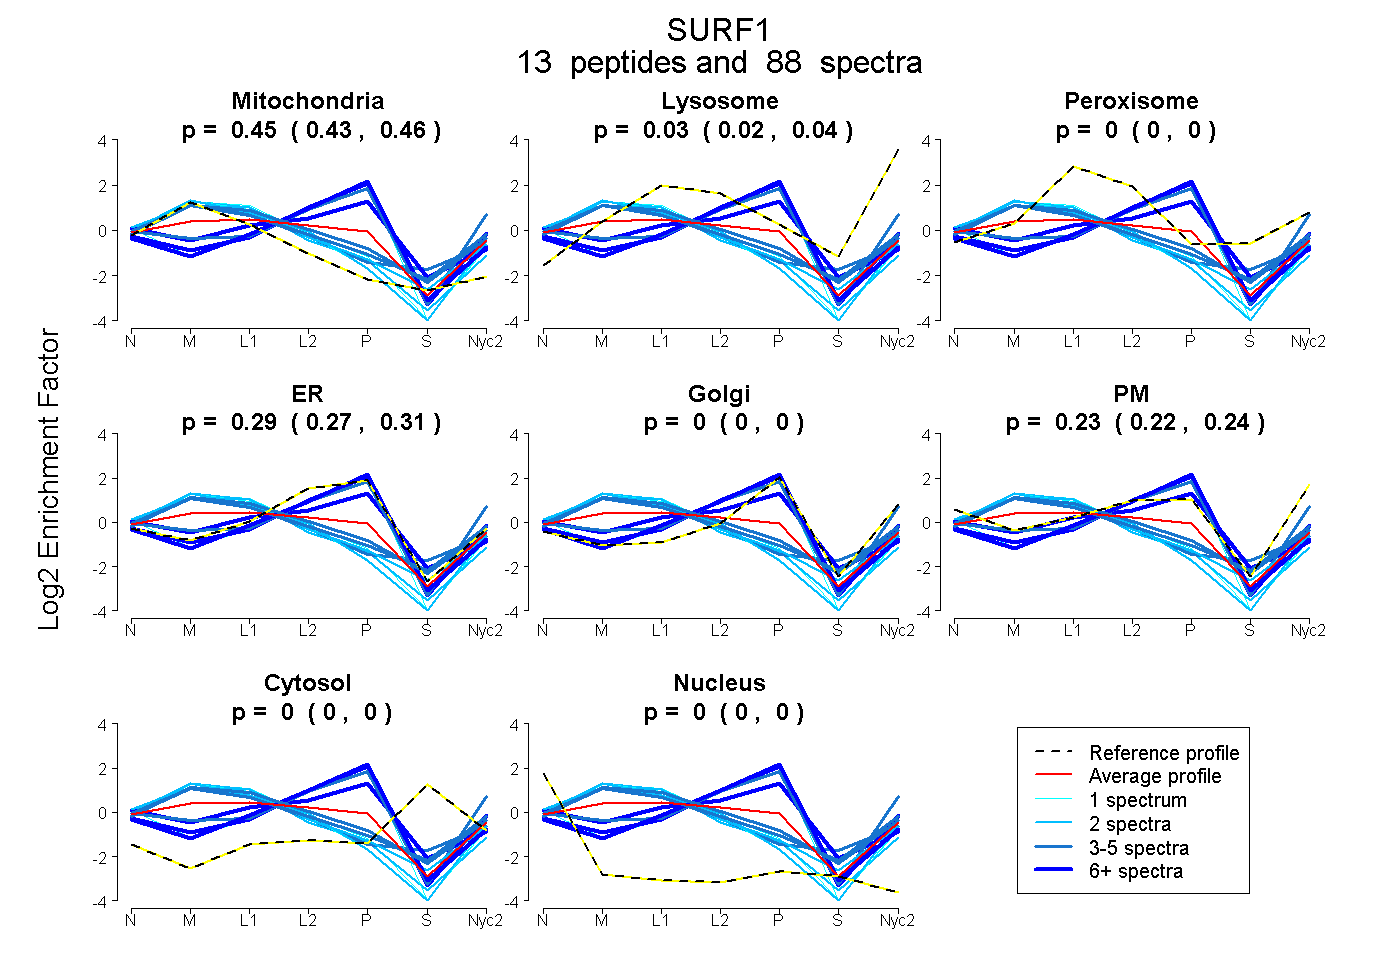
| Expt A |
13 peptides |
88 spectra |
|
0.447 0.433 | 0.458 |
0.030 0.022 | 0.037 |
0.000 0.000 | 0.000 |
0.291 0.270 | 0.309 |
0.000 0.000 | 0.000 |
0.232 0.219 | 0.243 |
0.000 0.000 | 0.000 |
0.000 0.000 | 0.000 |
| 5 spectra, TMVDPVR | 0.565 | 0.109 | 0.116 | 0.014 | 0.000 | 0.196 | 0.000 | 0.000 | ||
| 3 spectra, KPFVPENNPER | 0.642 | 0.097 | 0.170 | 0.000 | 0.000 | 0.061 | 0.030 | 0.000 | ||
| 13 spectra, QYLPHVAR | 0.138 | 0.000 | 0.059 | 0.671 | 0.052 | 0.000 | 0.030 | 0.049 | ||
| 2 spectra, QQGQVLGEVDLVGIVR | 0.719 | 0.070 | 0.000 | 0.000 | 0.000 | 0.211 | 0.000 | 0.000 | ||
| 1 spectrum, LCLISTFLEDGIR | 0.000 | 0.000 | 0.000 | 0.841 | 0.086 | 0.000 | 0.000 | 0.073 | ||
| 4 spectra, VNPETR | 0.609 | 0.173 | 0.031 | 0.000 | 0.000 | 0.186 | 0.000 | 0.000 | ||
| 1 spectrum, DLDAMAK | 0.700 | 0.051 | 0.000 | 0.008 | 0.000 | 0.241 | 0.000 | 0.000 | ||
| 2 spectra, SLWYYR | 0.652 | 0.042 | 0.121 | 0.000 | 0.000 | 0.185 | 0.000 | 0.000 | ||
| 7 spectra, MWFQWSEQR | 0.000 | 0.000 | 0.000 | 0.745 | 0.235 | 0.000 | 0.000 | 0.020 | ||
| 1 spectrum, LIAELESR | 0.748 | 0.066 | 0.000 | 0.000 | 0.000 | 0.186 | 0.000 | 0.000 | ||
| 42 spectra, SMFAGVPTMR | 0.000 | 0.000 | 0.000 | 0.884 | 0.057 | 0.000 | 0.000 | 0.058 | ||
| 5 spectra, QYMQLGGR | 0.000 | 0.000 | 0.000 | 0.419 | 0.262 | 0.319 | 0.000 | 0.000 | ||
| 2 spectra, ELYIMPR | 0.779 | 0.061 | 0.000 | 0.029 | 0.000 | 0.131 | 0.000 | 0.000 |
| Plot | Mito | Lyso or Perox | ER | Golgi | PM | Cytosol | Nucleus | ||||||
| Expt B |
2 peptides |
3 spectra |
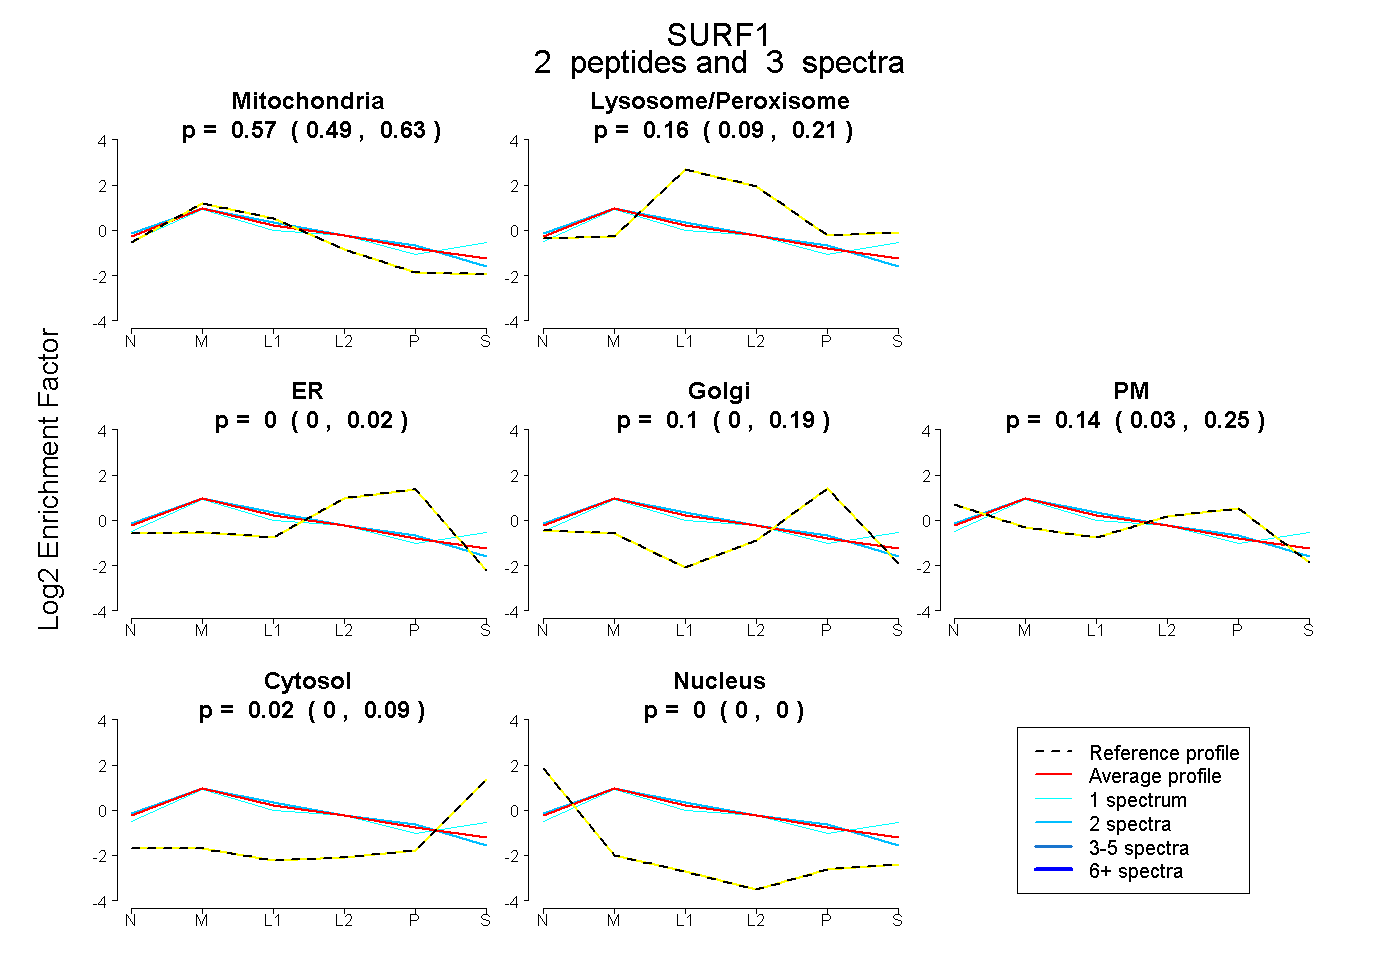 |
0.568 0.485 | 0.626 |
0.160 0.087 | 0.210 |
0.000 0.000 | 0.024 |
0.104 0.000 | 0.194 |
0.144 0.029 | 0.247 |
0.024 0.000 | 0.087 |
0.000 0.000 | 0.000 |
|||
| Plot | Lyso | Other | |||||||||||
| Expt C |
18 peptides |
121 spectra |
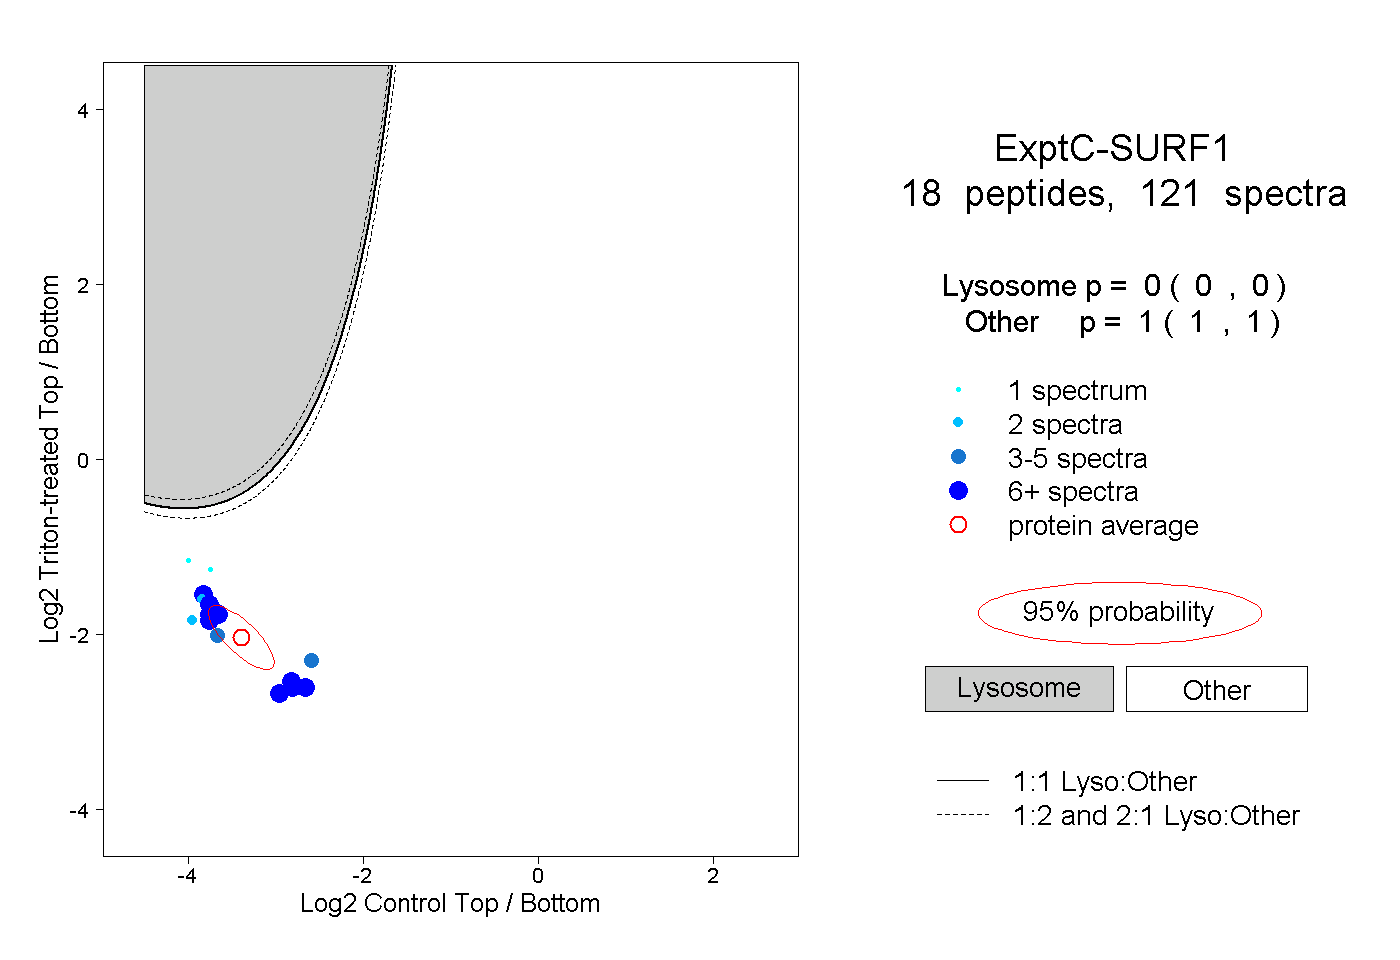 |
0.000 0.000 | 0.000 |
1.000 1.000 | 1.000 |
||||||||
| Plot | Lyso | Other | |||||||||||
| Expt D |
5 peptides |
12 spectra |
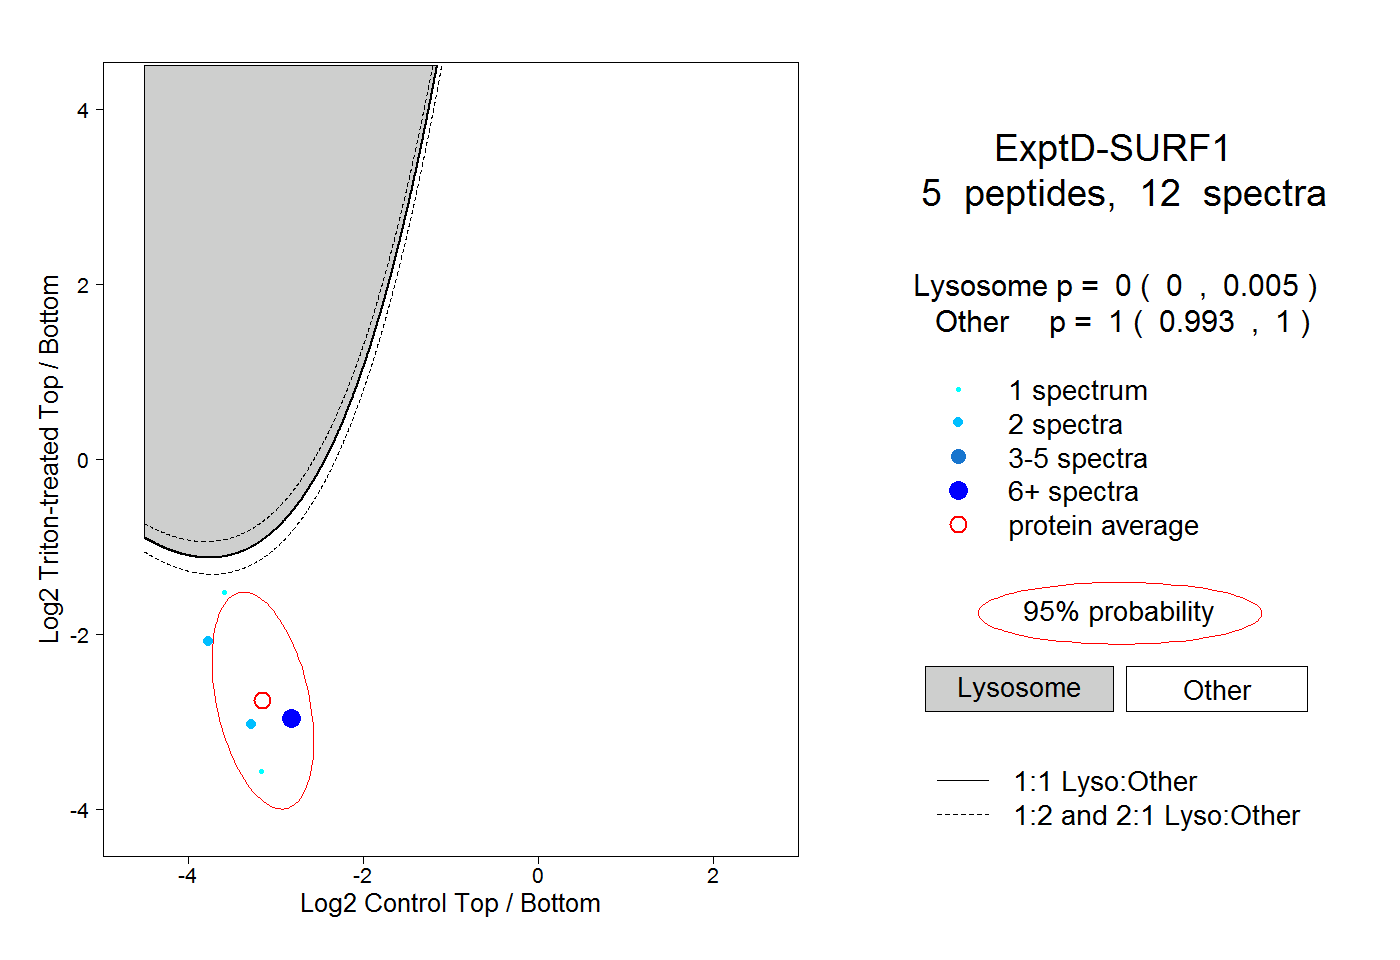 |
0.000 0.000 | 0.005 |
1.000 0.993 | 1.000 |