 3
3peptides
spectra
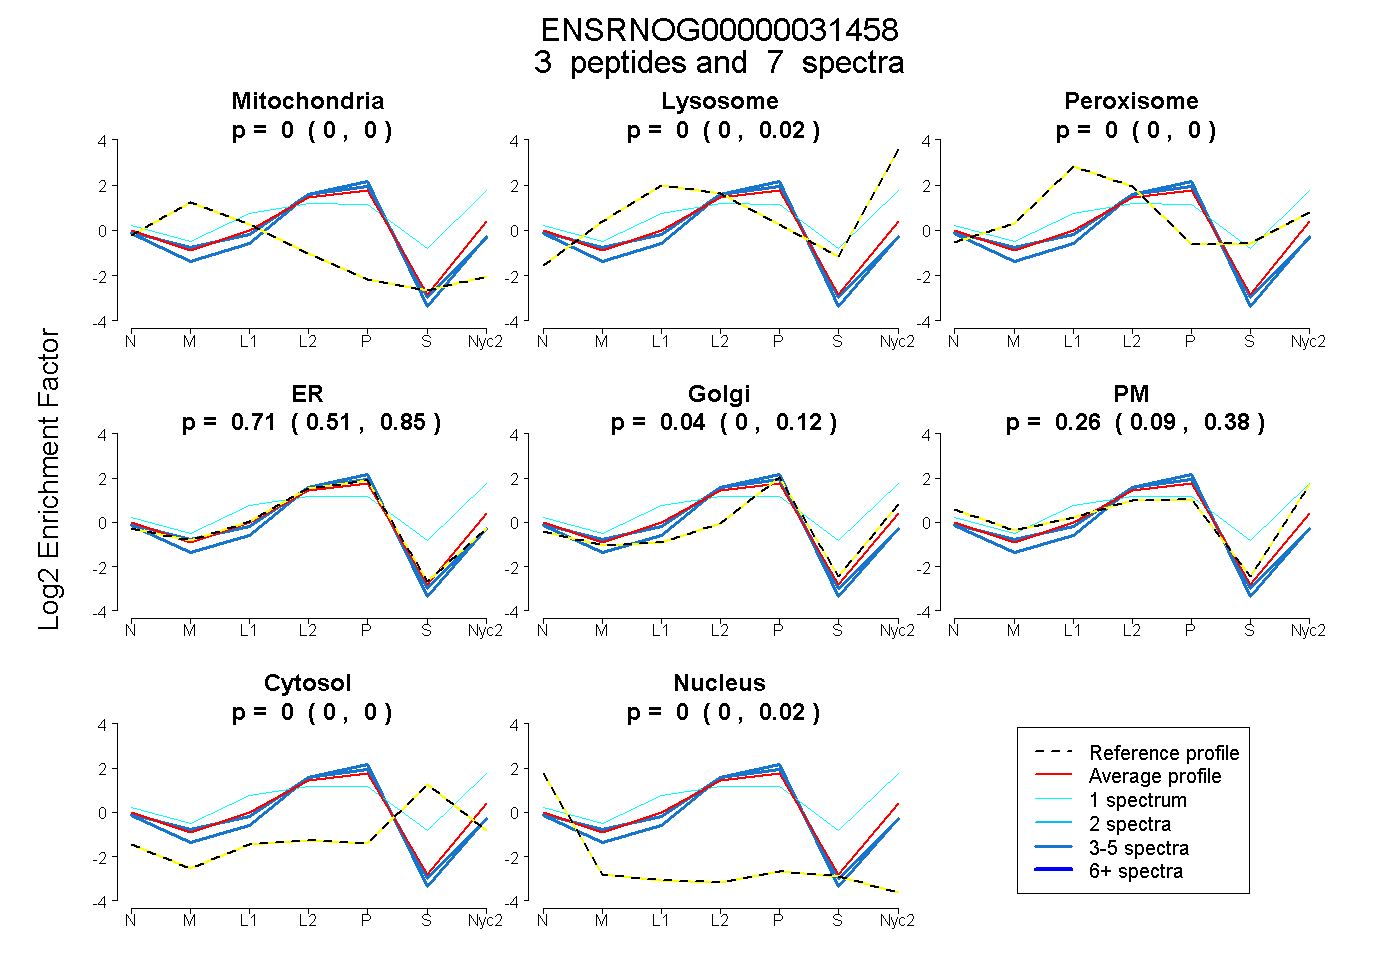
0.000 | 0.000
0.000 | 0.019
0.000 | 0.000
0.513 | 0.847
0.000 | 0.118
0.092 | 0.385
0.000 | 0.002
0.000 | 0.020
1peptide
spectrum
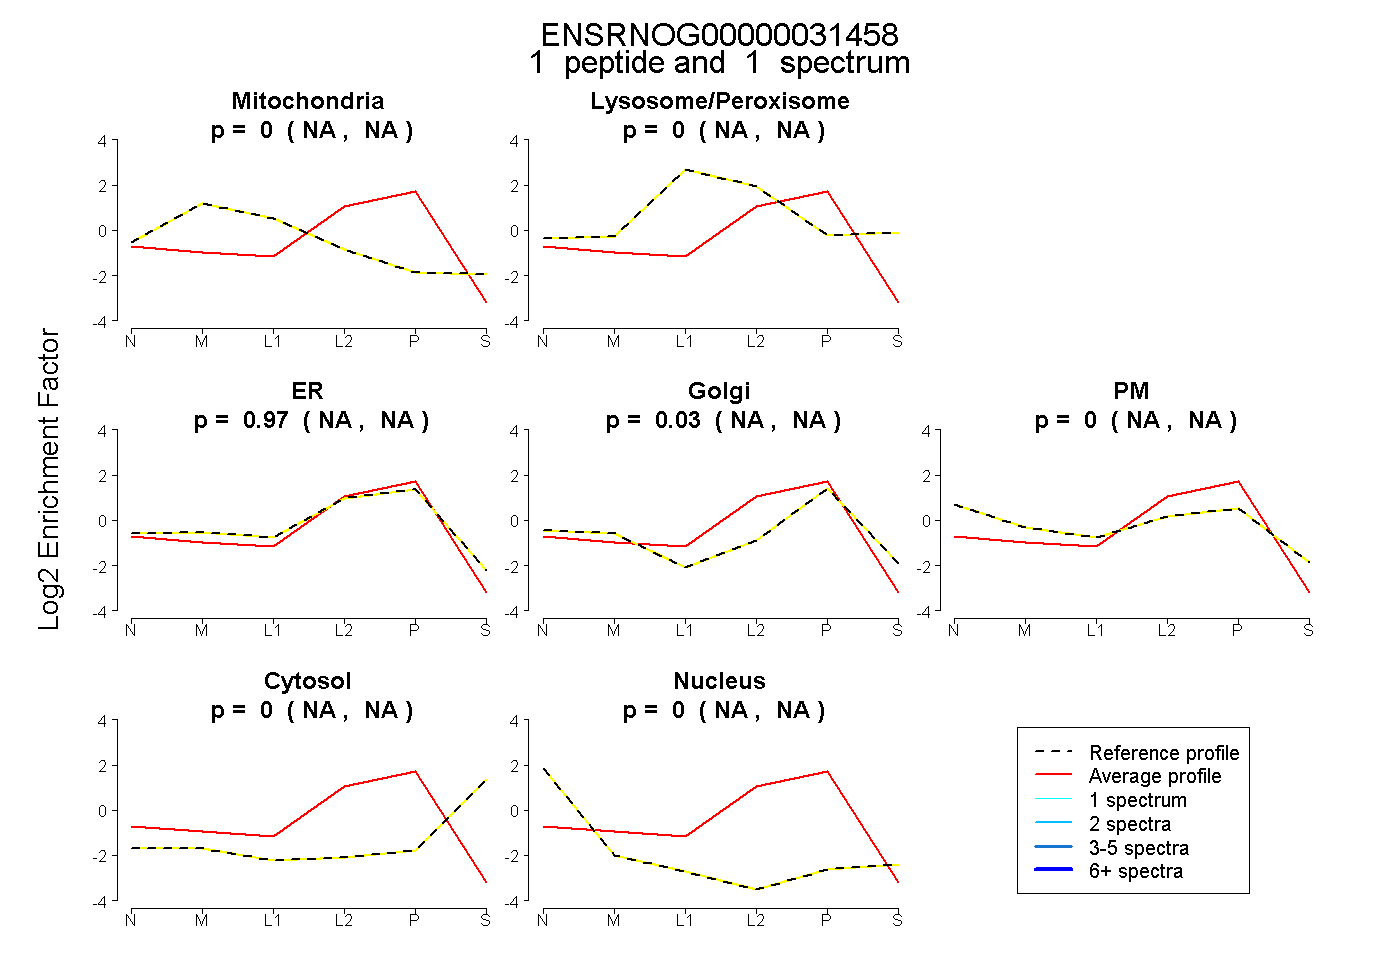
NA | NA
NA | NA
NA | NA
NA | NA
NA | NA
NA | NA
NA | NA
2peptides
spectra

0.000 | 0.000
1.000 | 1.000