 8
8peptides
spectra
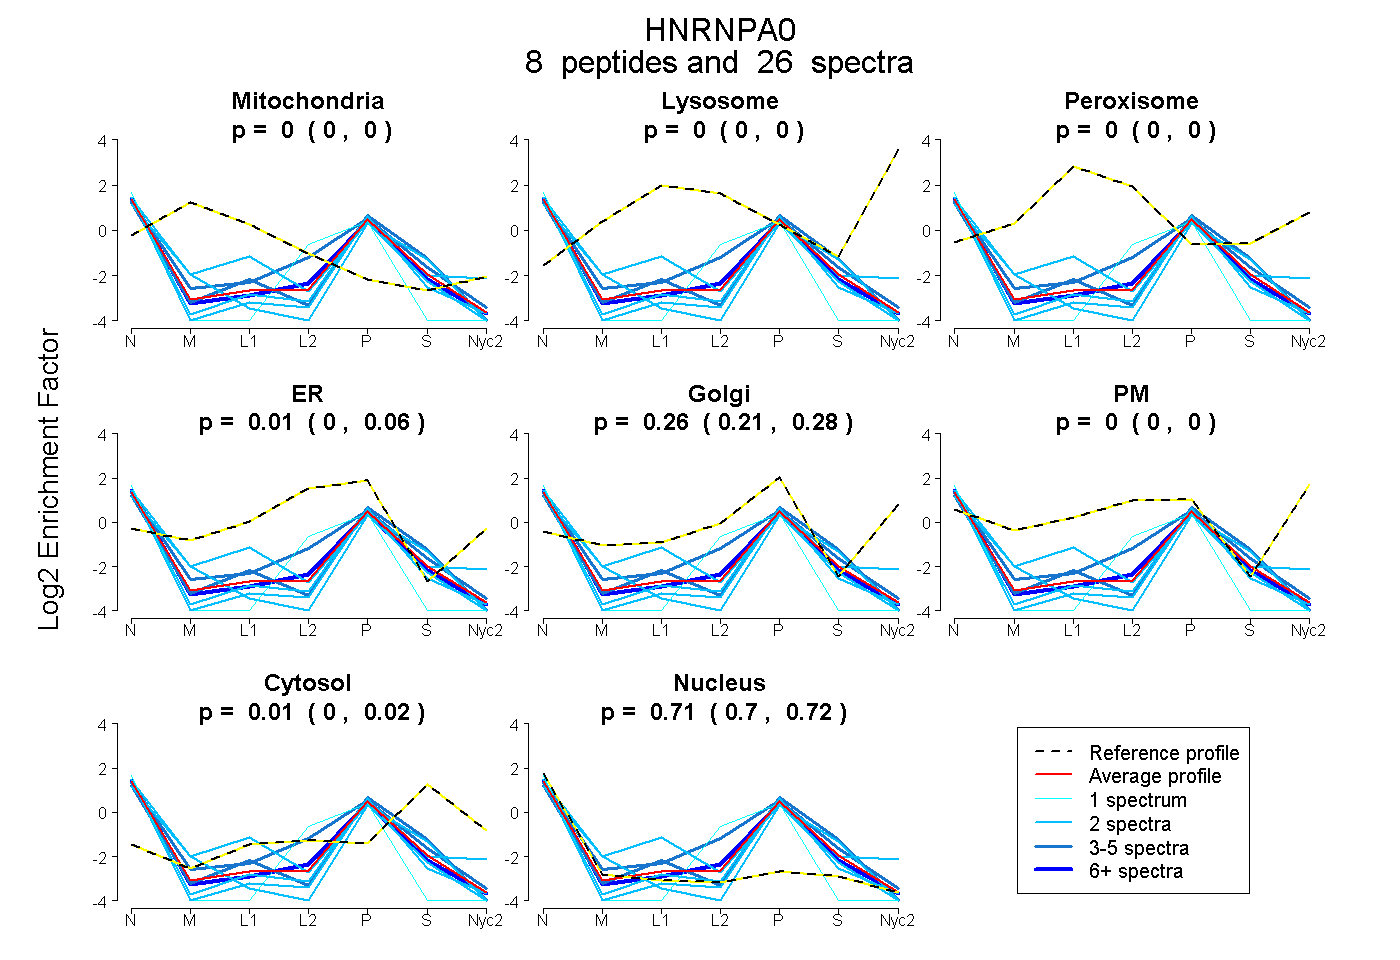
0.000 | 0.000
0.000 | 0.000
0.000 | 0.000
0.000 | 0.055
0.215 | 0.281
0.000 | 0.000
0.000 | 0.021
0.703 | 0.723
2peptides
spectra
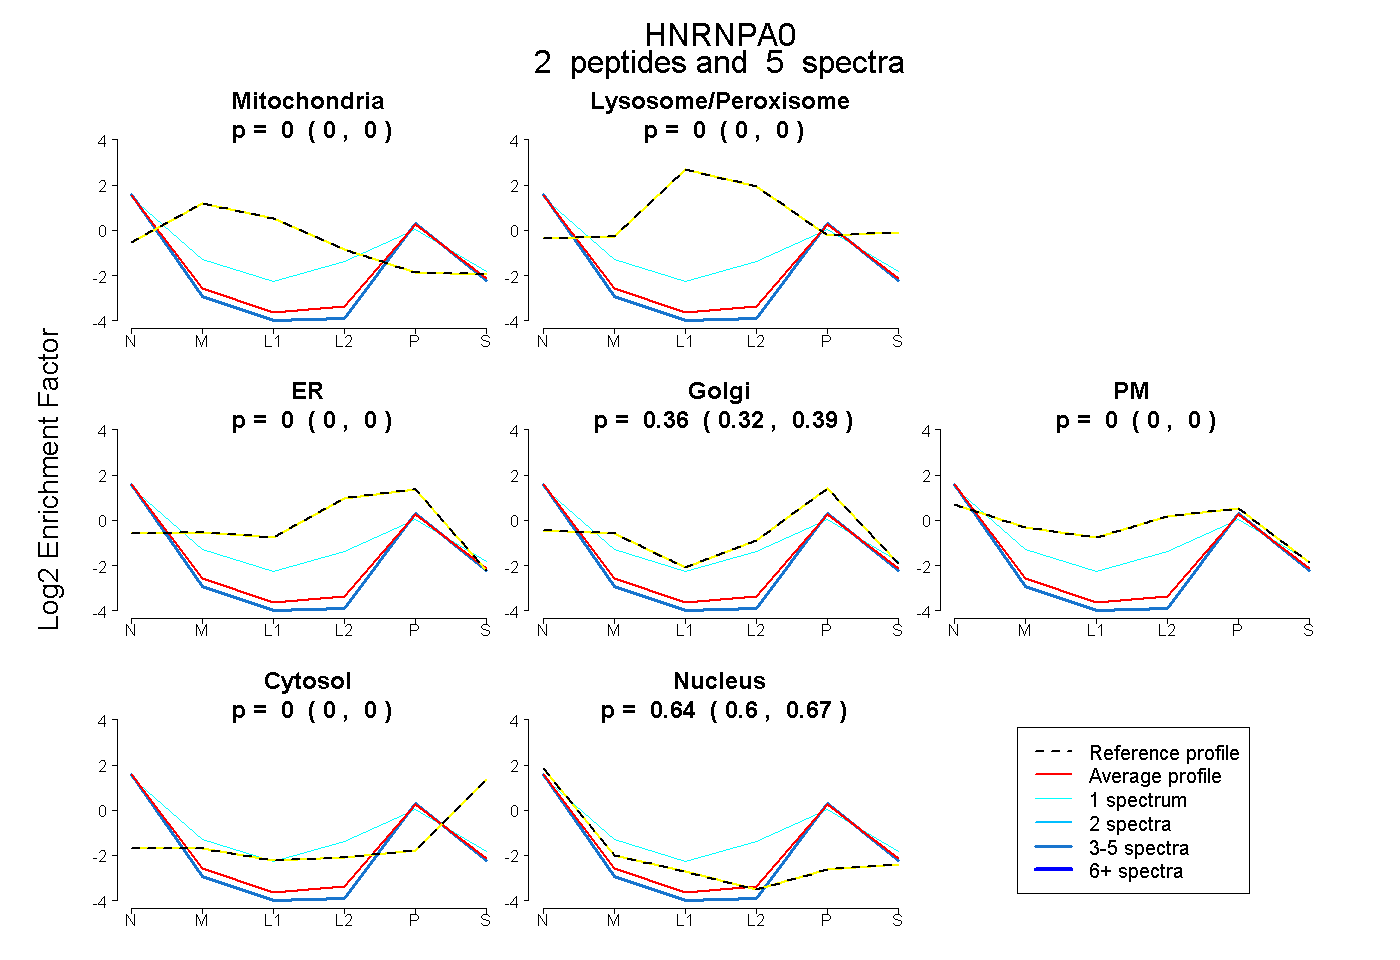
0.000 | 0.000
0.000 | 0.000
0.000 | 0.000
0.323 | 0.395
0.000 | 0.000
0.000 | 0.000
0.599 | 0.669
2peptides
spectra
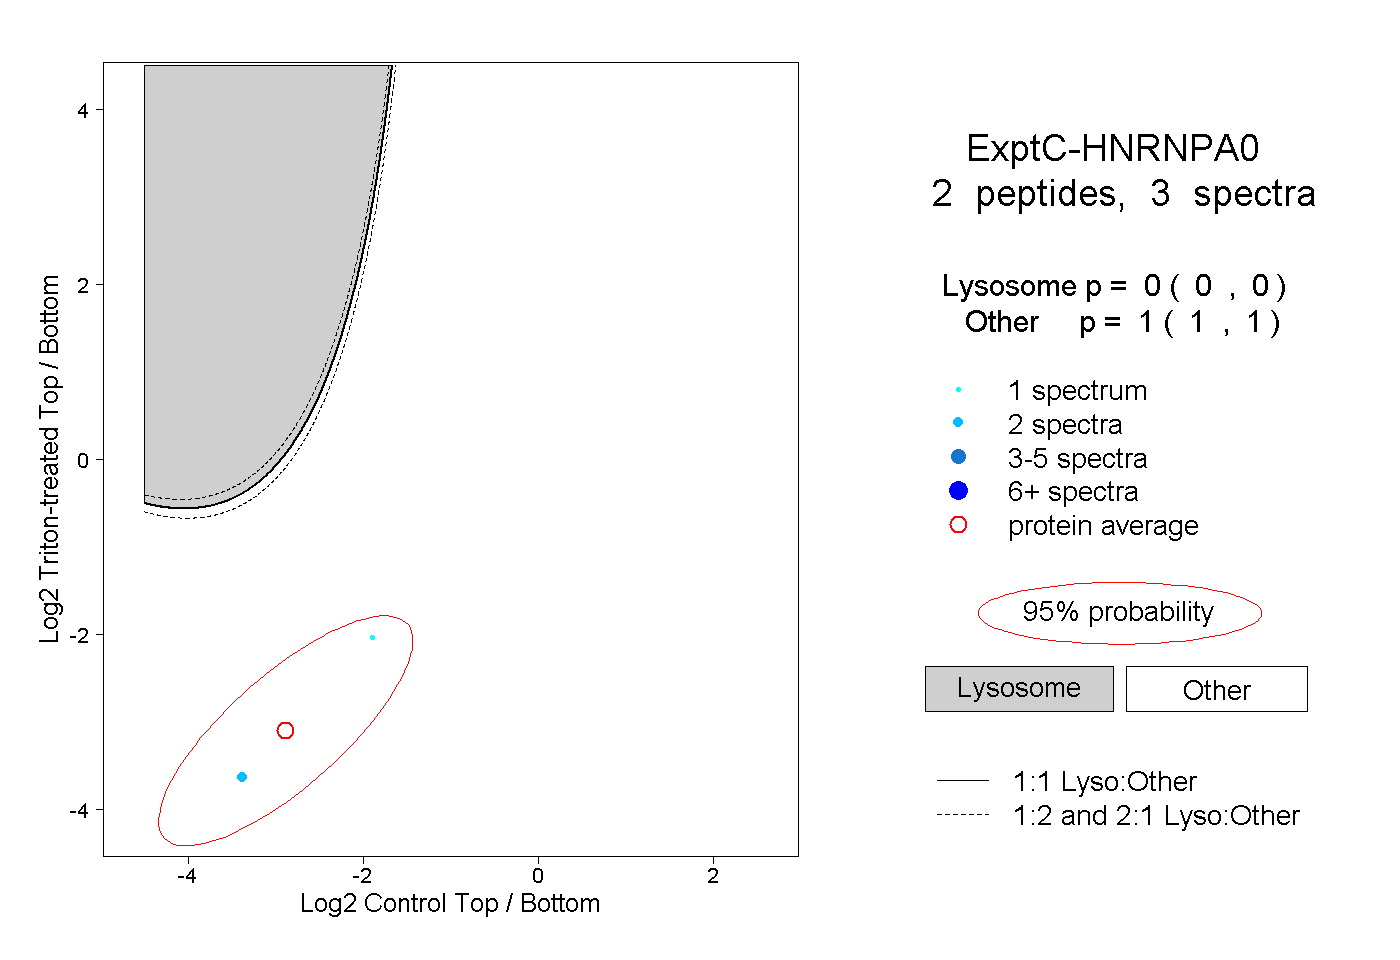
0.000 | 0.000
1.000 | 1.000
1peptide
spectrum
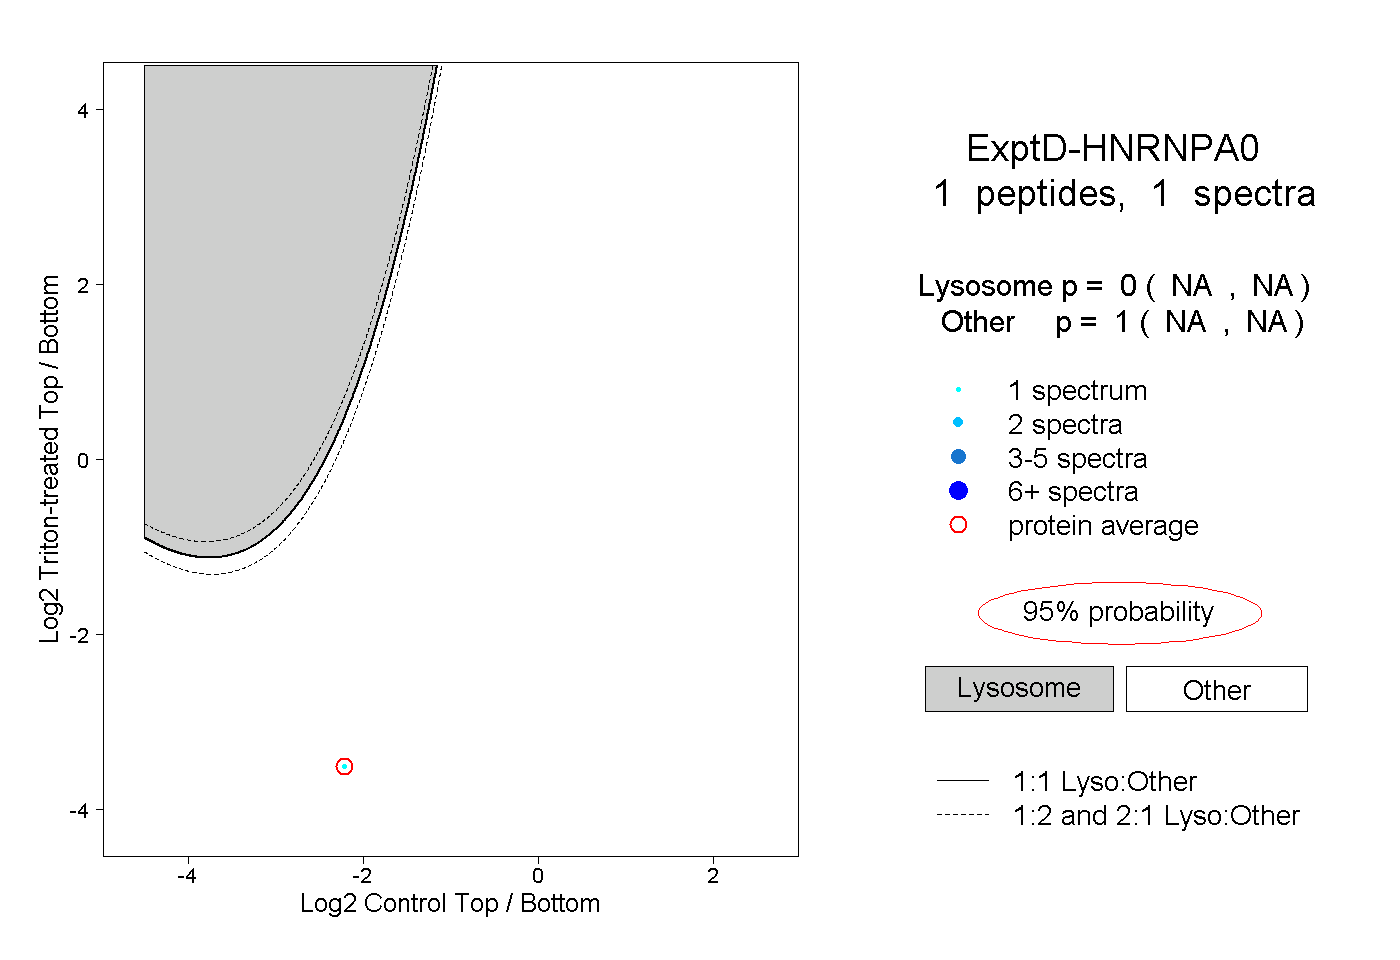
NA | NA
NA | NA