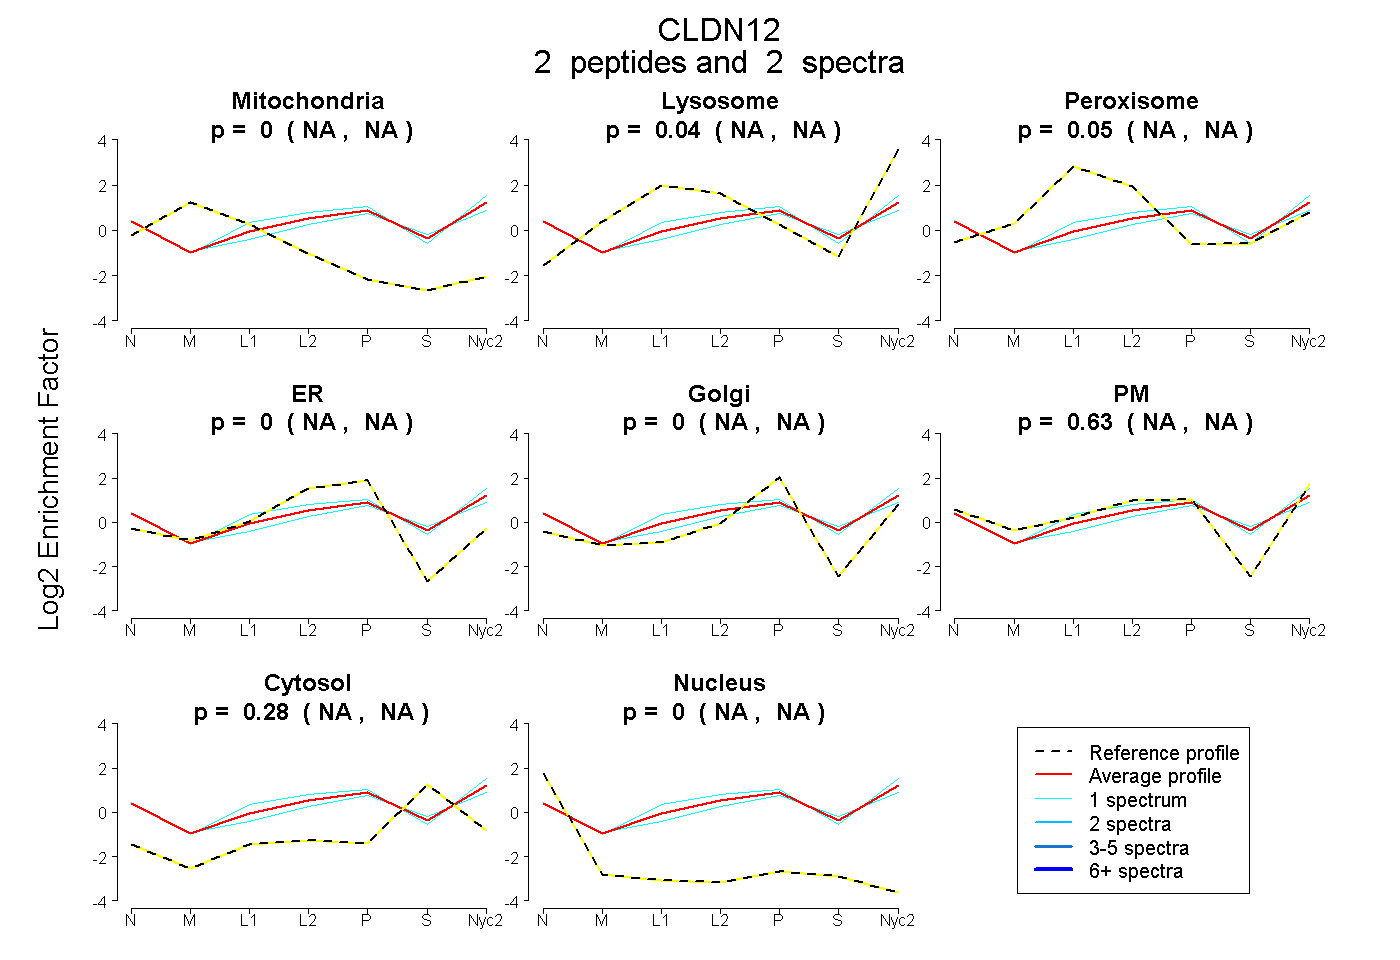
 2
2peptides
spectra
NA | NA
NA | NA
NA | NA
NA | NA
NA | NA
NA | NA
NA | NA
NA | NA
| Plot | Mito | Lyso | Perox | ER | Golgi | PM | Cytosol | Nucleus | |||||
| Expt A |
2 peptides |
2 spectra |
|
0.000 NA | NA |
0.043 NA | NA |
0.046 NA | NA |
0.000 NA | NA |
0.000 NA | NA |
0.629 NA | NA |
0.282 NA | NA |
0.000 NA | NA |
| 1 spectrum, SSVPNIK | 0.000 | 0.096 | 0.065 | 0.000 | 0.000 | 0.634 | 0.205 | 0.000 | ||
| 1 spectrum, LITFNR | 0.000 | 0.000 | 0.021 | 0.000 | 0.000 | 0.619 | 0.360 | 0.000 |
| Plot | Lyso | Other | |||||||||||
| Expt C |
2 peptides |
6 spectra |
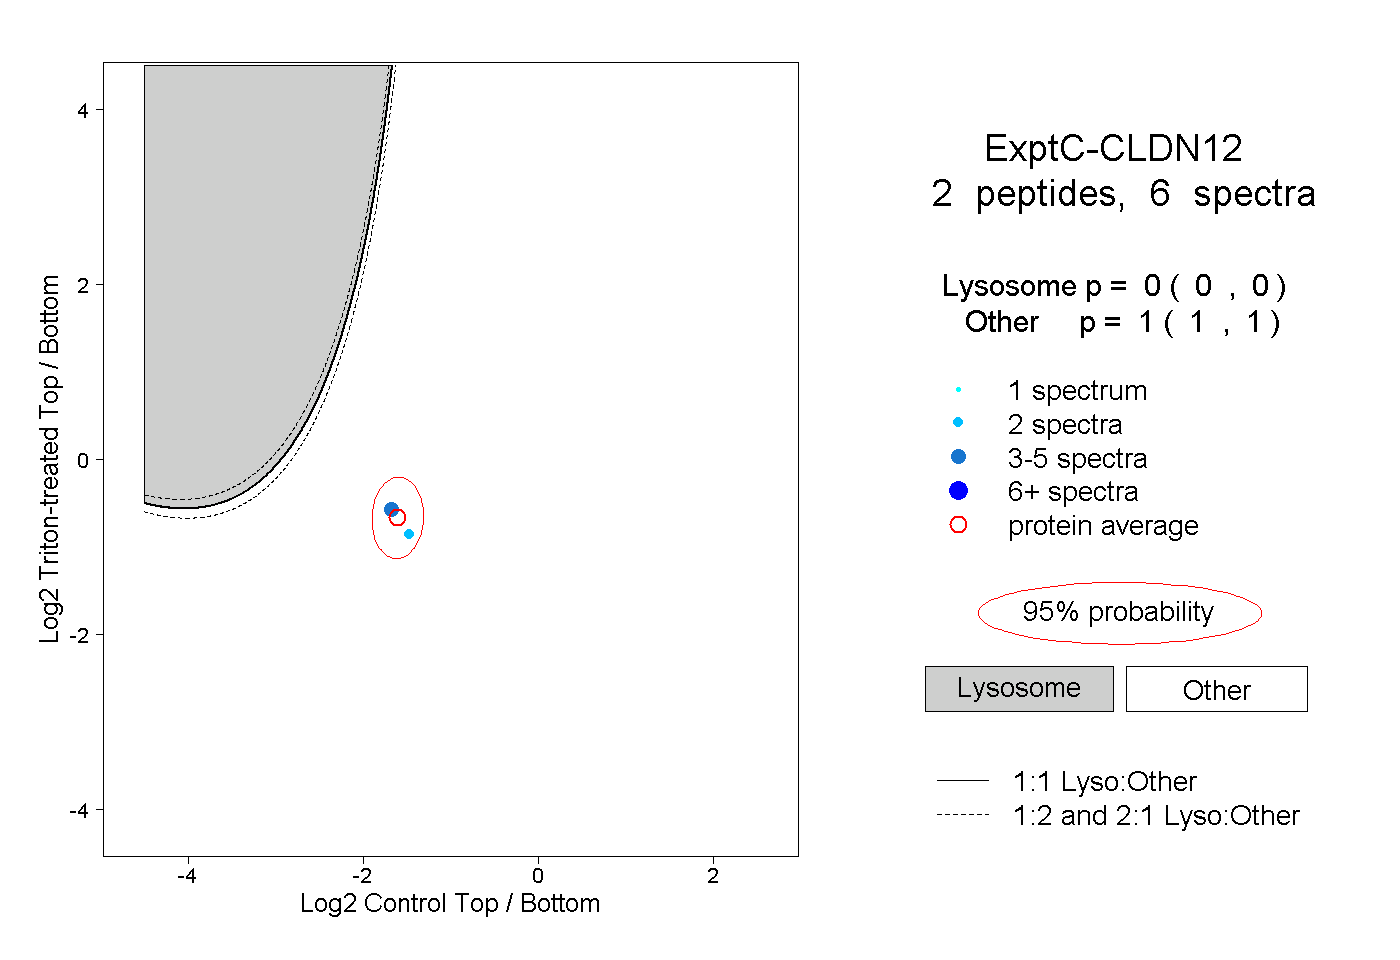 |
0.000 0.000 | 0.000 |
1.000 1.000 | 1.000 |