 1
1peptide
spectra
0.000 | 0.000
0.371 | 0.673
0.000 | 0.095
0.000 | 0.000
0.000 | 0.000
0.072 | 0.298
0.178 | 0.288
0.000 | 0.000
3peptides
spectra
0.999 | 1.000
0.000 | 0.001
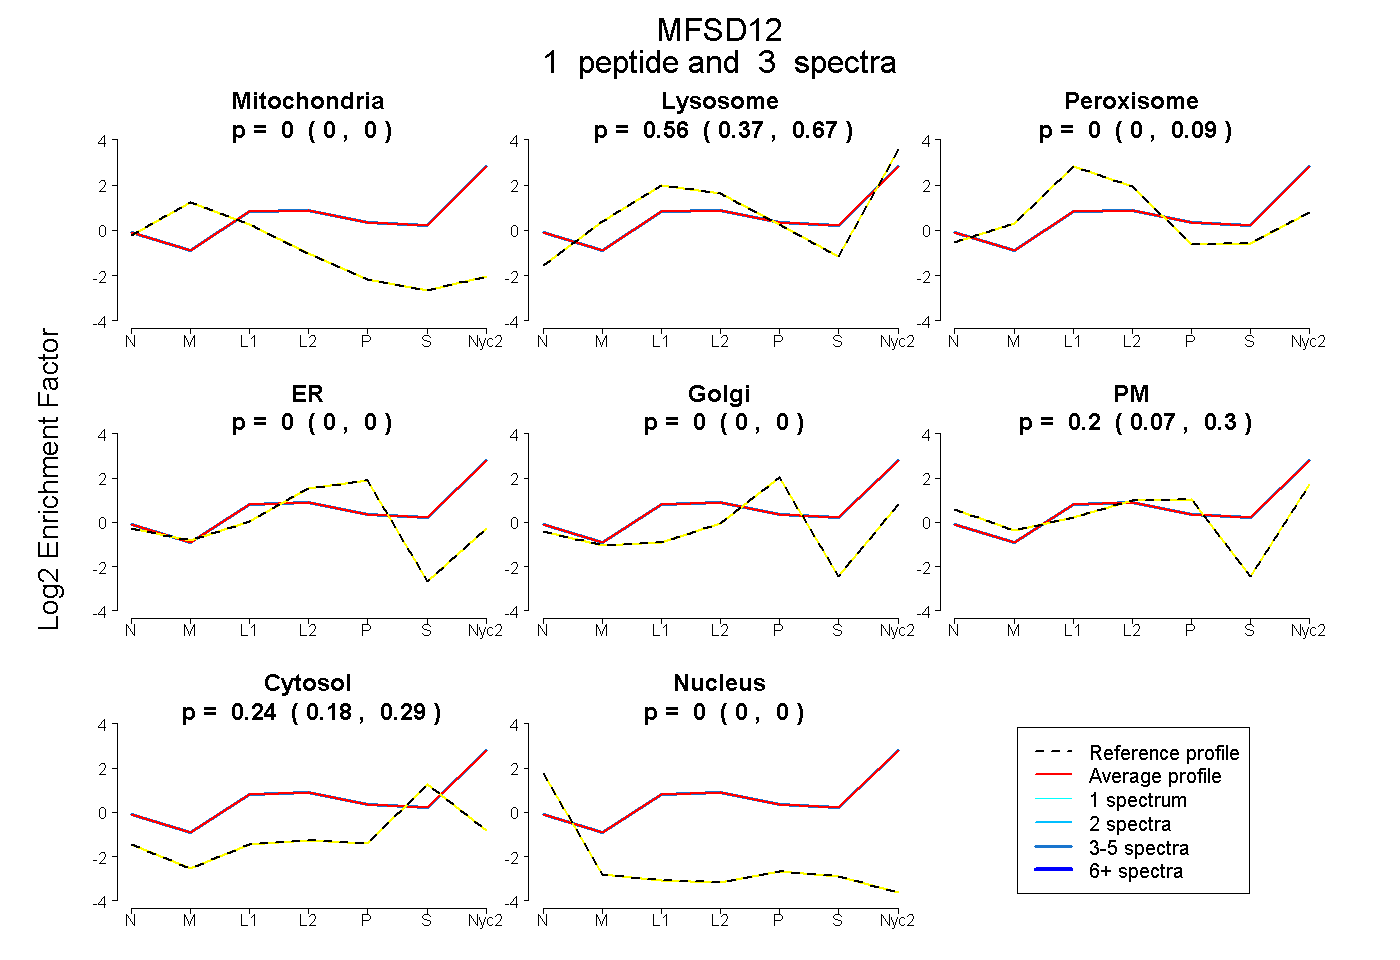
| Plot | Mito | Lyso | Perox | ER | Golgi | PM | Cytosol | Nucleus | |||||
| Expt A |
1 peptide |
3 spectra |
|
0.000 0.000 | 0.000 |
0.560 0.371 | 0.673 |
0.000 0.000 | 0.095 |
0.000 0.000 | 0.000 |
0.000 0.000 | 0.000 |
0.198 0.072 | 0.298 |
0.242 0.178 | 0.288 |
0.000 0.000 | 0.000 |
||
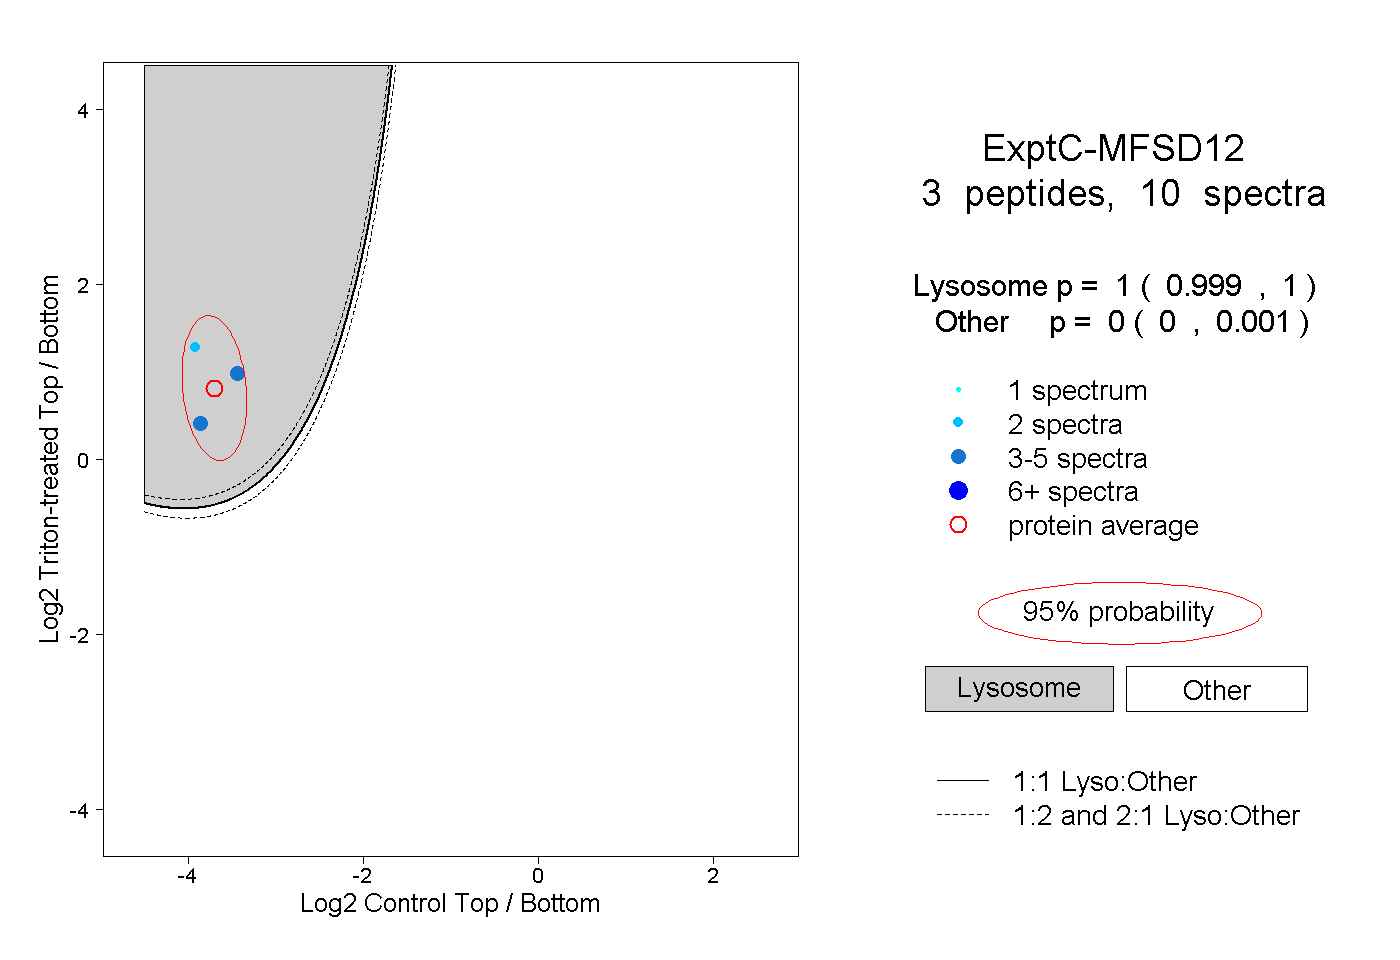
| Plot | Lyso | Other | |||||||||||
| Expt C |
3 peptides |
10 spectra |
|
1.000 0.999 | 1.000 |
0.000 0.000 | 0.001 |