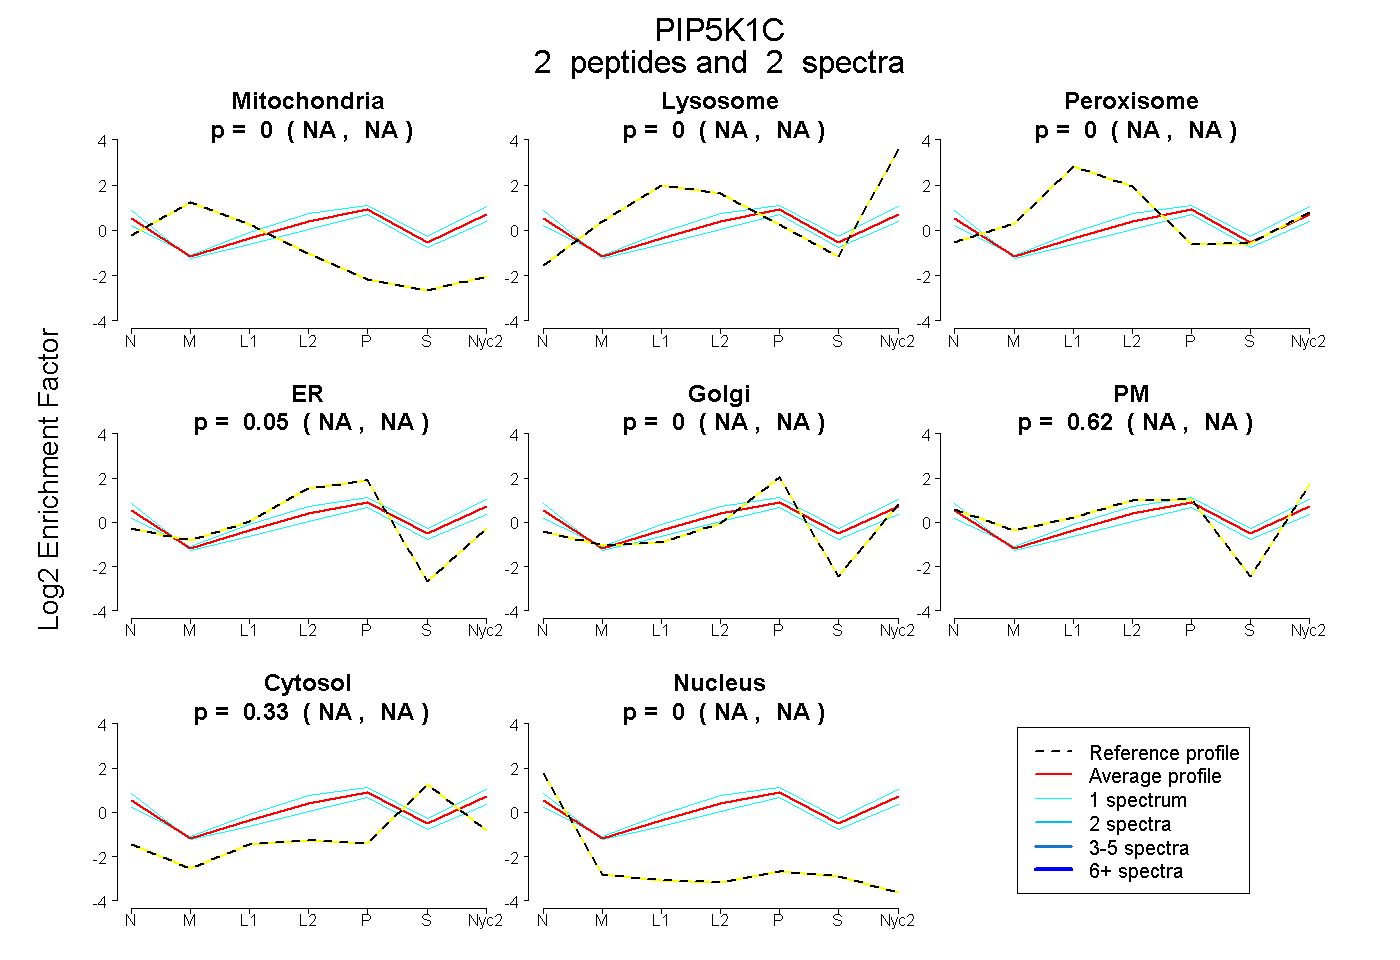
 2
2peptides
spectra
NA | NA
NA | NA
NA | NA
NA | NA
NA | NA
NA | NA
NA | NA
NA | NA
| Plot | Mito | Lyso | Perox | ER | Golgi | PM | Cytosol | Nucleus | |||||
| Expt A |
2 peptides |
2 spectra |
|
0.000 NA | NA |
0.000 NA | NA |
0.000 NA | NA |
0.055 NA | NA |
0.000 NA | NA |
0.619 NA | NA |
0.326 NA | NA |
0.000 NA | NA |
| 1 spectrum, VVVMNNVLPR | 0.000 | 0.000 | 0.000 | 0.018 | 0.031 | 0.595 | 0.290 | 0.066 | ||
| 1 spectrum, IMDYSLLLGVHNIDQQER | 0.000 | 0.072 | 0.038 | 0.081 | 0.017 | 0.506 | 0.287 | 0.000 |
| Plot | Lyso | Other | |||||||||||
| Expt C |
1 peptide |
4 spectra |
 |
0.000 0.000 | 0.000 |
1.000 1.000 | 1.000 |
||||||||
| Plot | Lyso | Other | |||||||||||
| Expt D |
2 peptides |
2 spectra |
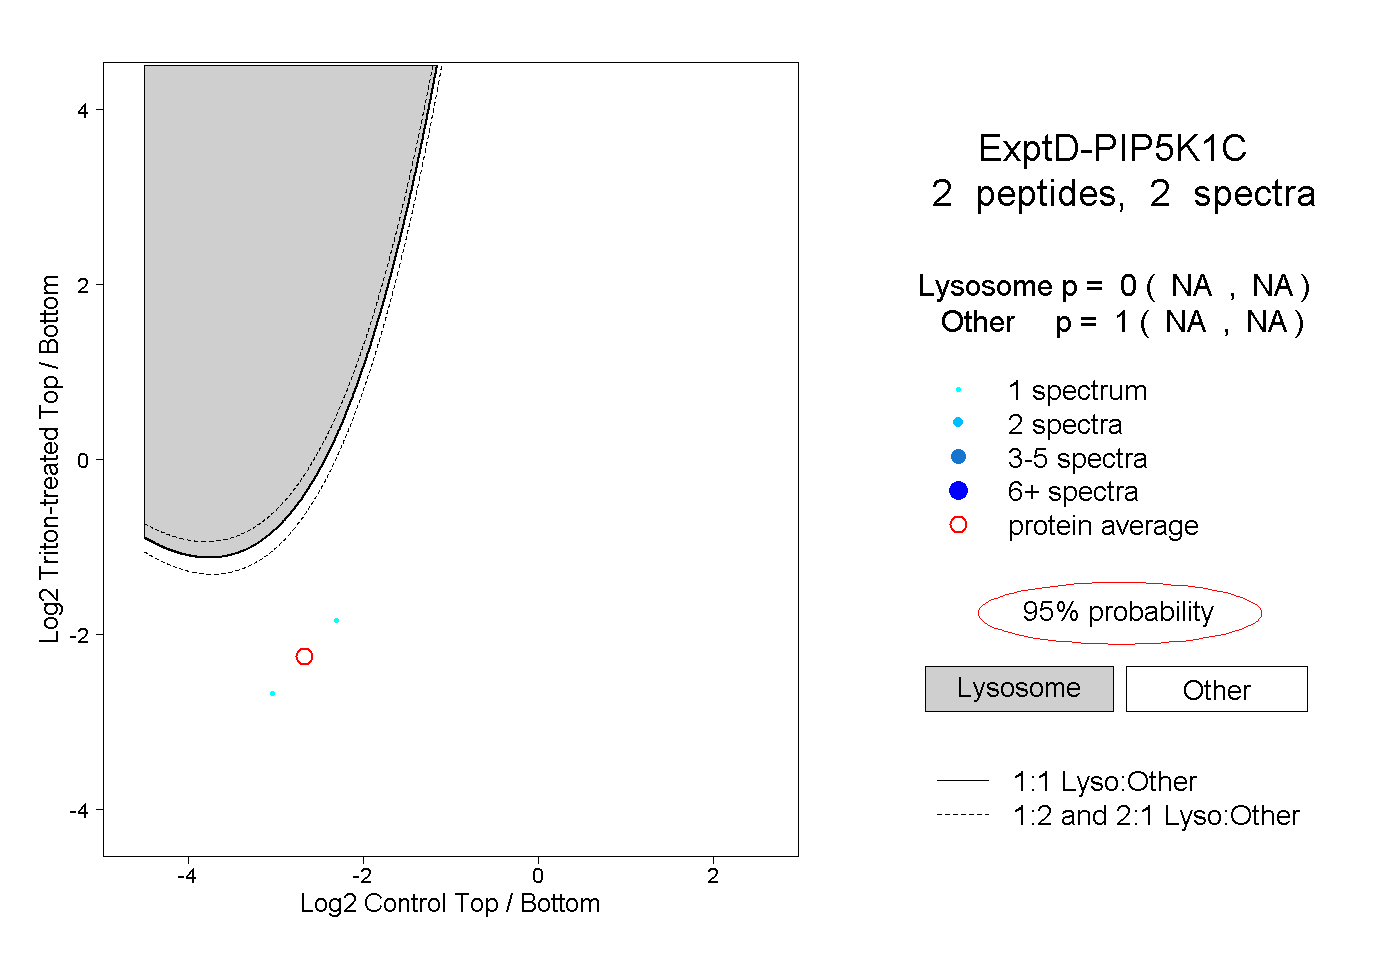 |
0.000 NA | NA |
1.000 NA | NA |