 1
1peptide
spectrum
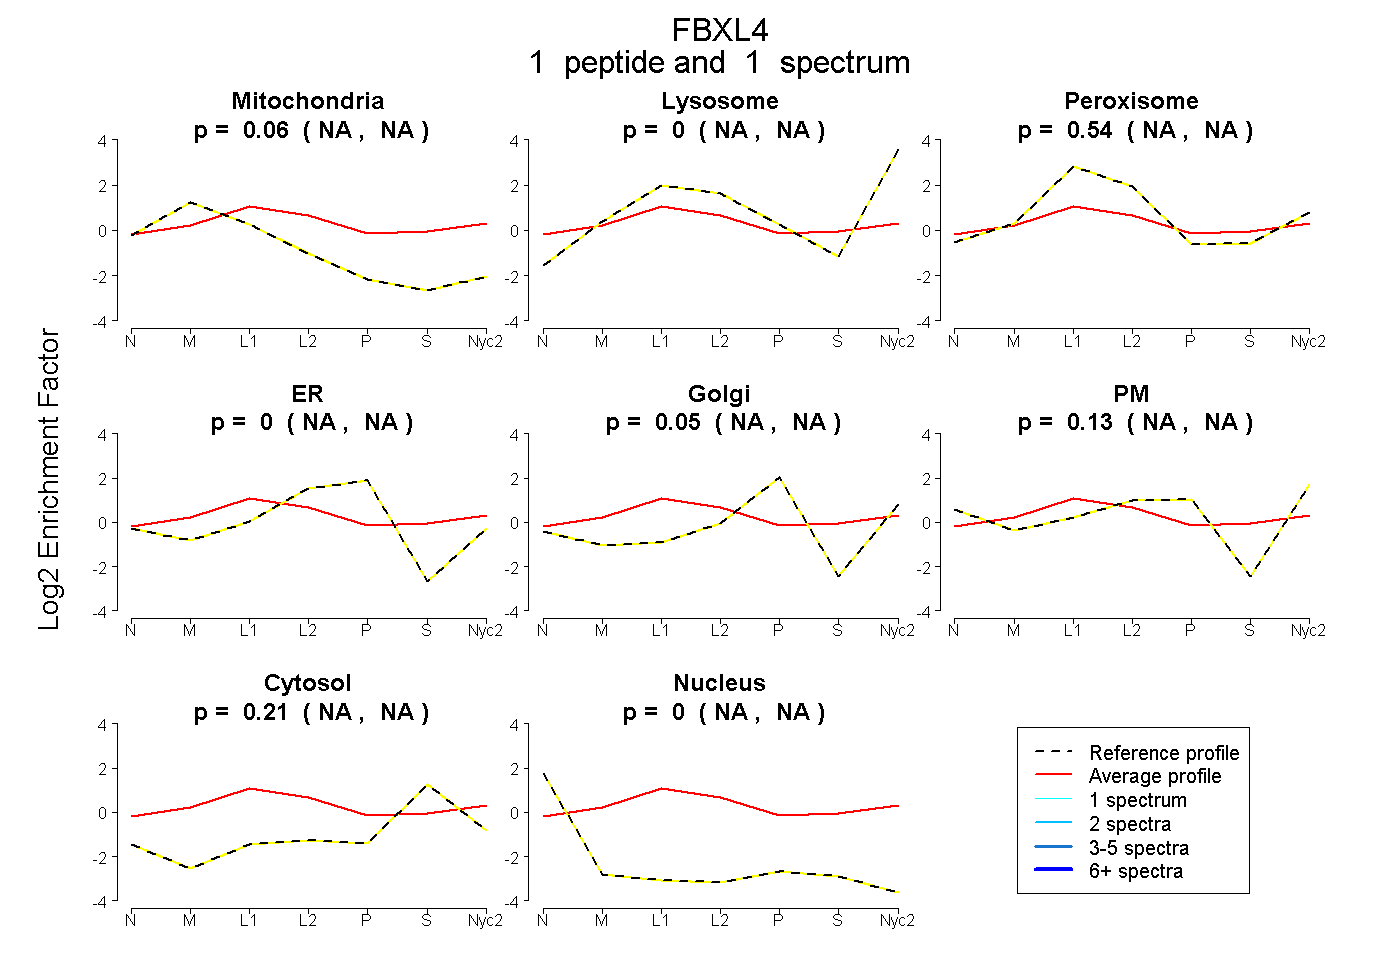
NA | NA
NA | NA
NA | NA
NA | NA
NA | NA
NA | NA
NA | NA
NA | NA
5peptides
spectra
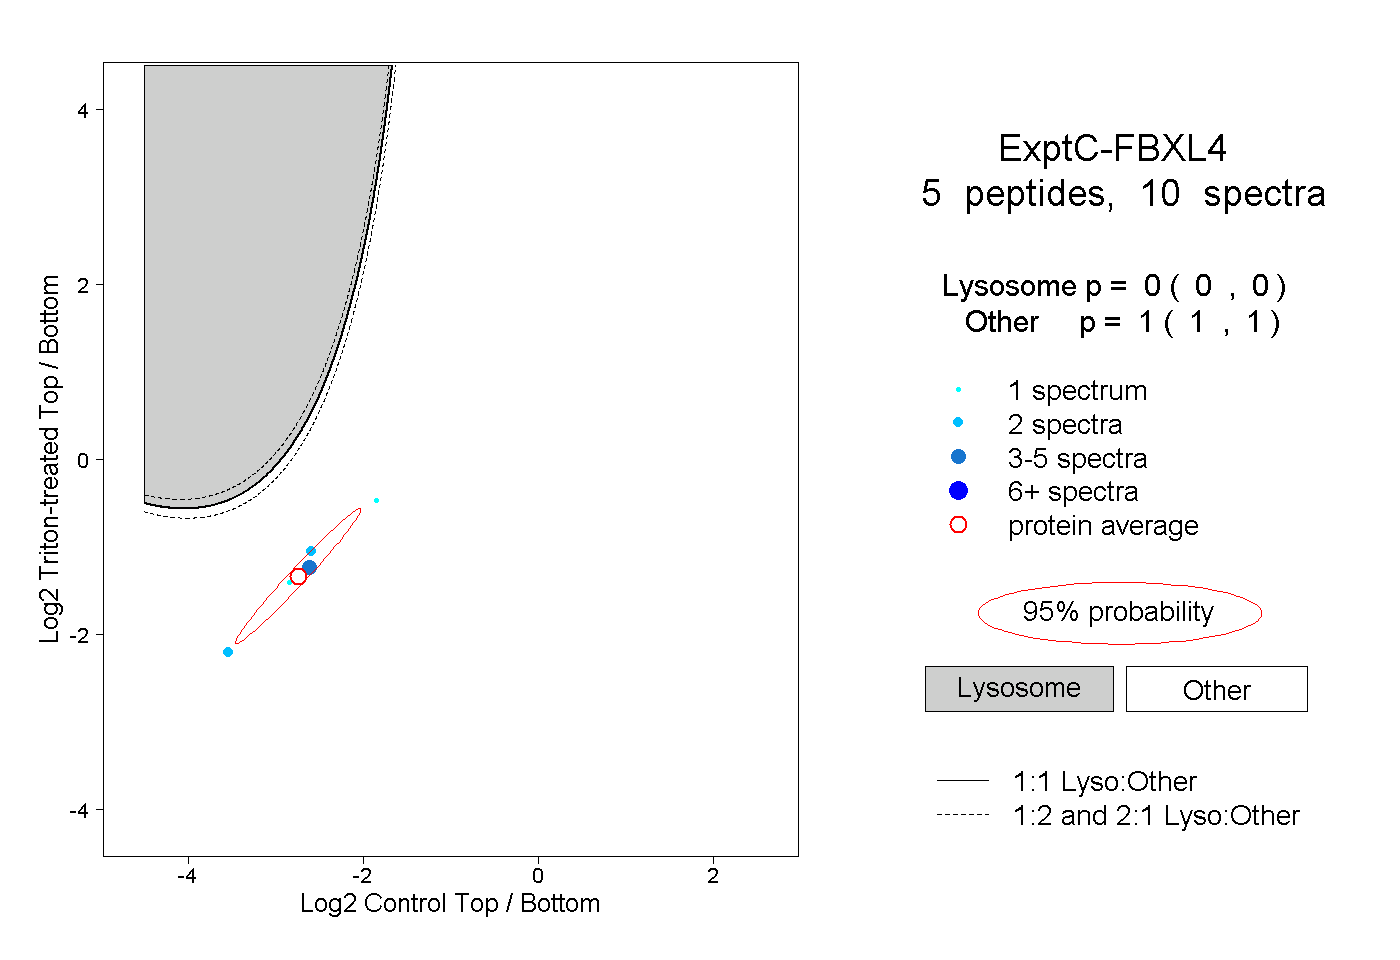
0.000 | 0.000
1.000 | 1.000
| Plot | Mito | Lyso | Perox | ER | Golgi | PM | Cytosol | Nucleus | |||||
| Expt A |
1 peptide |
1 spectrum |
|
0.064 NA | NA |
0.000 NA | NA |
0.542 NA | NA |
0.000 NA | NA |
0.048 NA | NA |
0.133 NA | NA |
0.213 NA | NA |
0.000 NA | NA |
||
| Plot | Lyso | Other | |||||||||||
| Expt C |
5 peptides |
10 spectra |
|
0.000 0.000 | 0.000 |
1.000 1.000 | 1.000 |