 2
2peptides
spectra
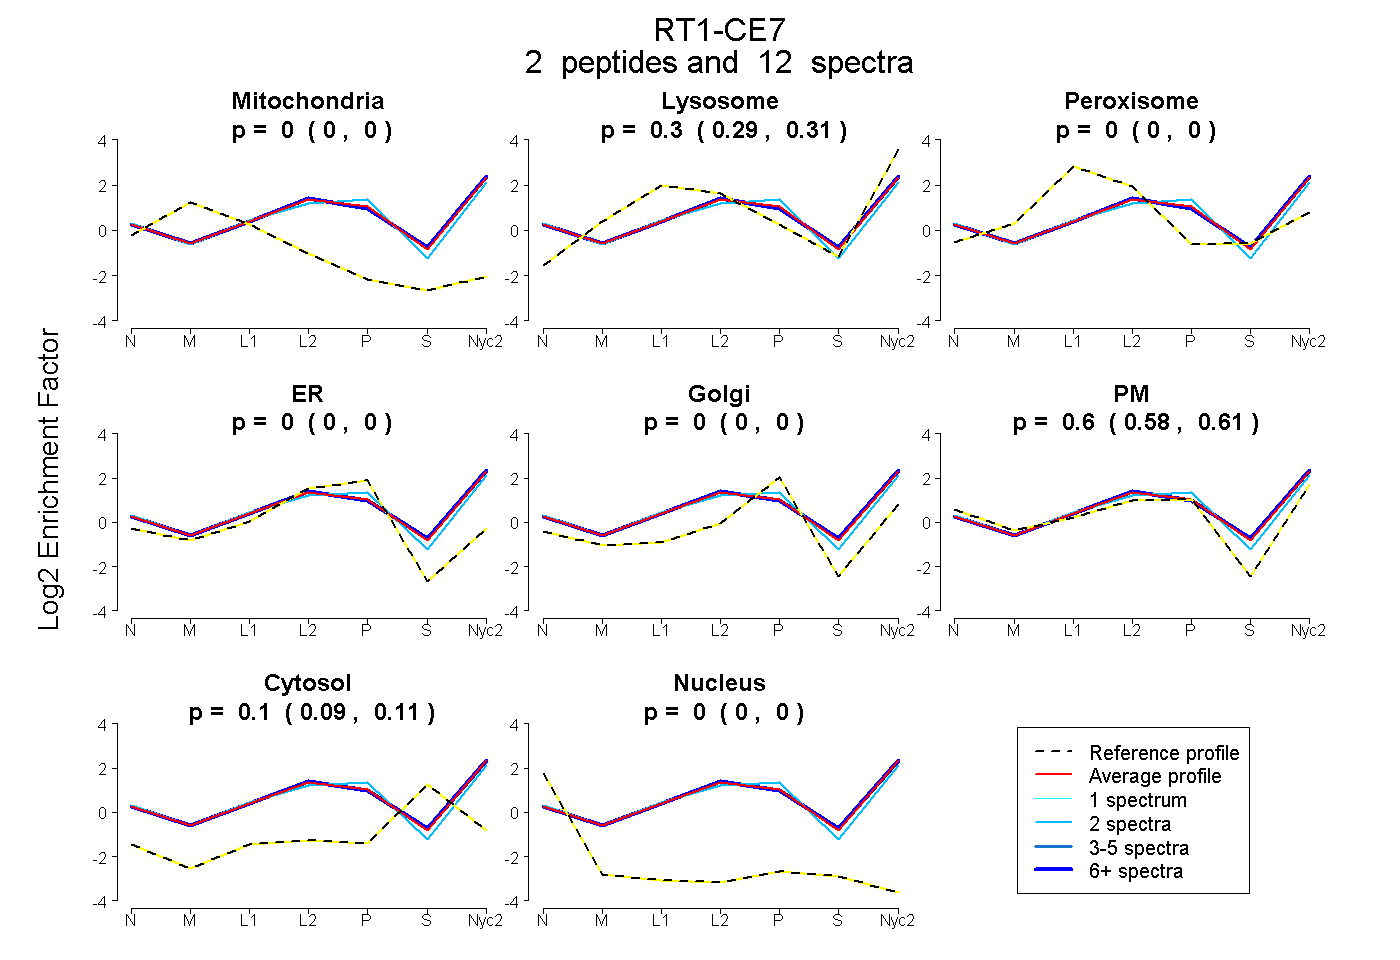
0.000 | 0.000
0.290 | 0.313
0.000 | 0.000
0.000 | 0.000
0.000 | 0.000
0.578 | 0.610
0.091 | 0.109
0.000 | 0.000
5peptides
spectra
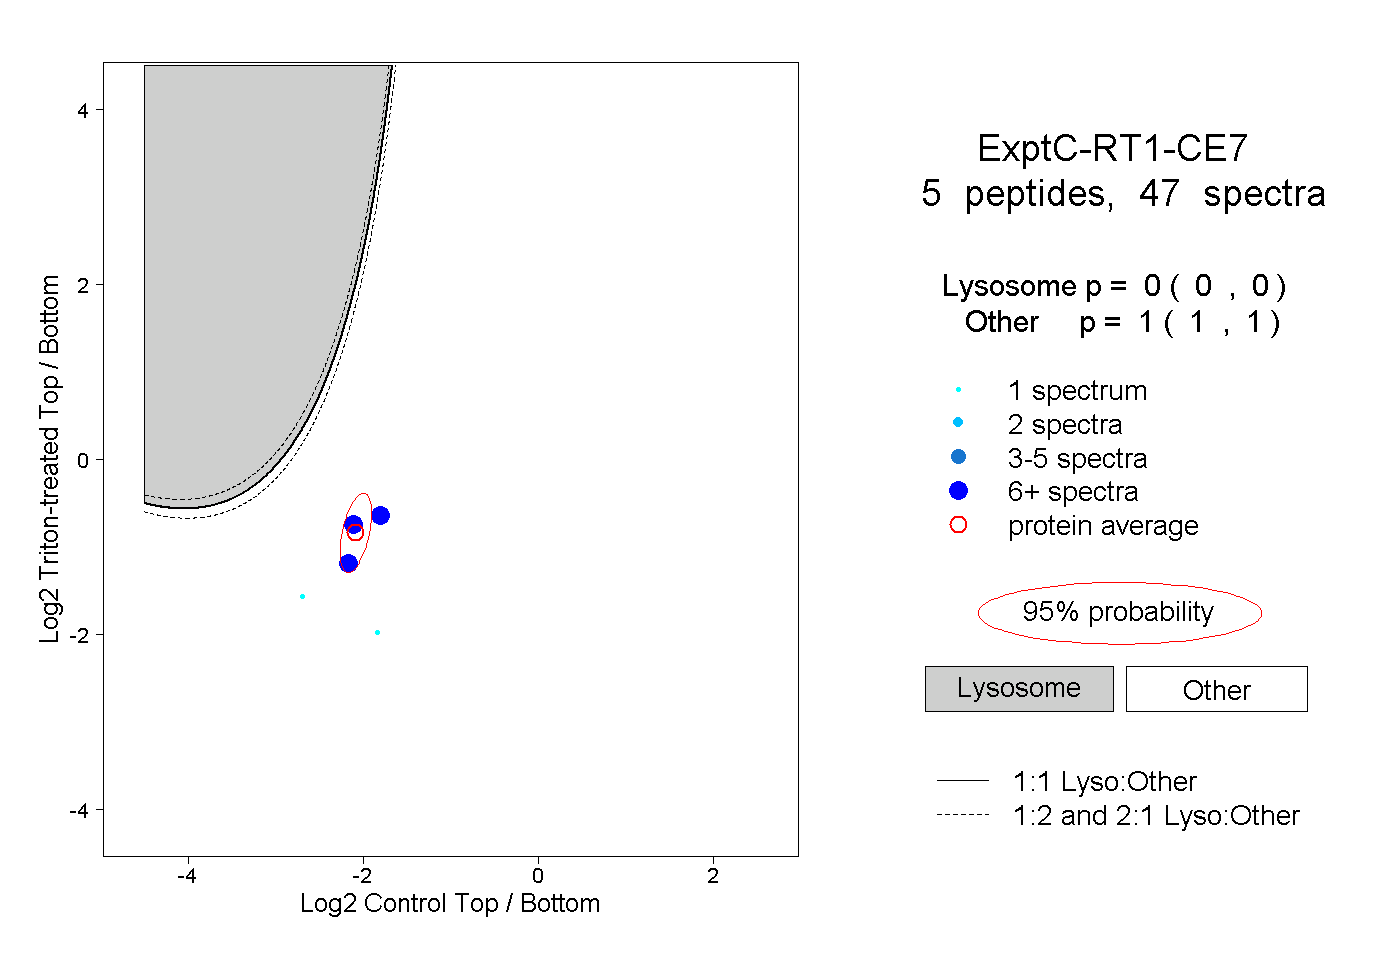
0.000 | 0.000
1.000 | 1.000
| Plot | Mito | Lyso | Perox | ER | Golgi | PM | Cytosol | Nucleus | |||||
| Expt A |
2 peptides |
12 spectra |
|
0.000 0.000 | 0.000 |
0.303 0.290 | 0.313 |
0.000 0.000 | 0.000 |
0.000 0.000 | 0.000 |
0.000 0.000 | 0.000 |
0.596 0.578 | 0.610 |
0.101 0.091 | 0.109 |
0.000 0.000 | 0.000 |
||
| Plot | Lyso | Other | |||||||||||
| Expt C |
5 peptides |
47 spectra |
|
0.000 0.000 | 0.000 |
1.000 1.000 | 1.000 |