 2
2peptides
spectra
0.000 | 0.000
0.000 | 0.000
0.000 | 0.000
0.000 | 0.273
0.000 | 0.177
0.169 | 0.380
0.224 | 0.296
0.201 | 0.268
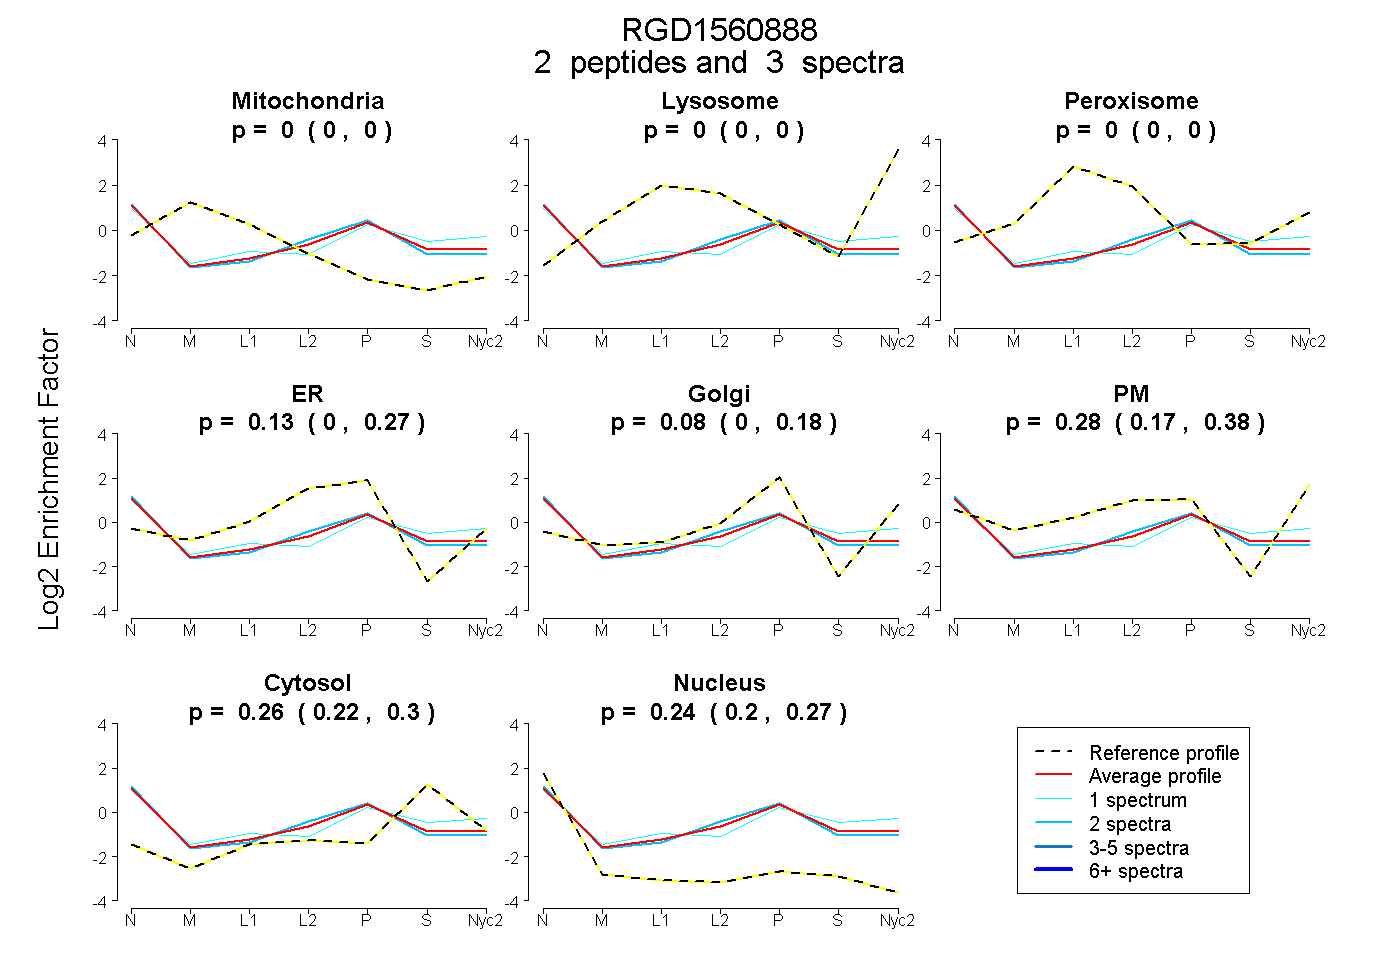
| Plot | Mito | Lyso | Perox | ER | Golgi | PM | Cytosol | Nucleus | |||||
| Expt A |
2 peptides |
3 spectra |
|
0.000 0.000 | 0.000 |
0.000 0.000 | 0.000 |
0.000 0.000 | 0.000 |
0.132 0.000 | 0.273 |
0.085 0.000 | 0.177 |
0.284 0.169 | 0.380 |
0.261 0.224 | 0.296 |
0.239 0.201 | 0.268 |
| 2 spectra, AFHLLQK | 0.000 | 0.000 | 0.000 | 0.280 | 0.035 | 0.198 | 0.219 | 0.267 | ||
| 1 spectrum, VEDLFEYEGCK | 0.000 | 0.000 | 0.000 | 0.000 | 0.078 | 0.391 | 0.350 | 0.181 |