 6
6peptides
spectra
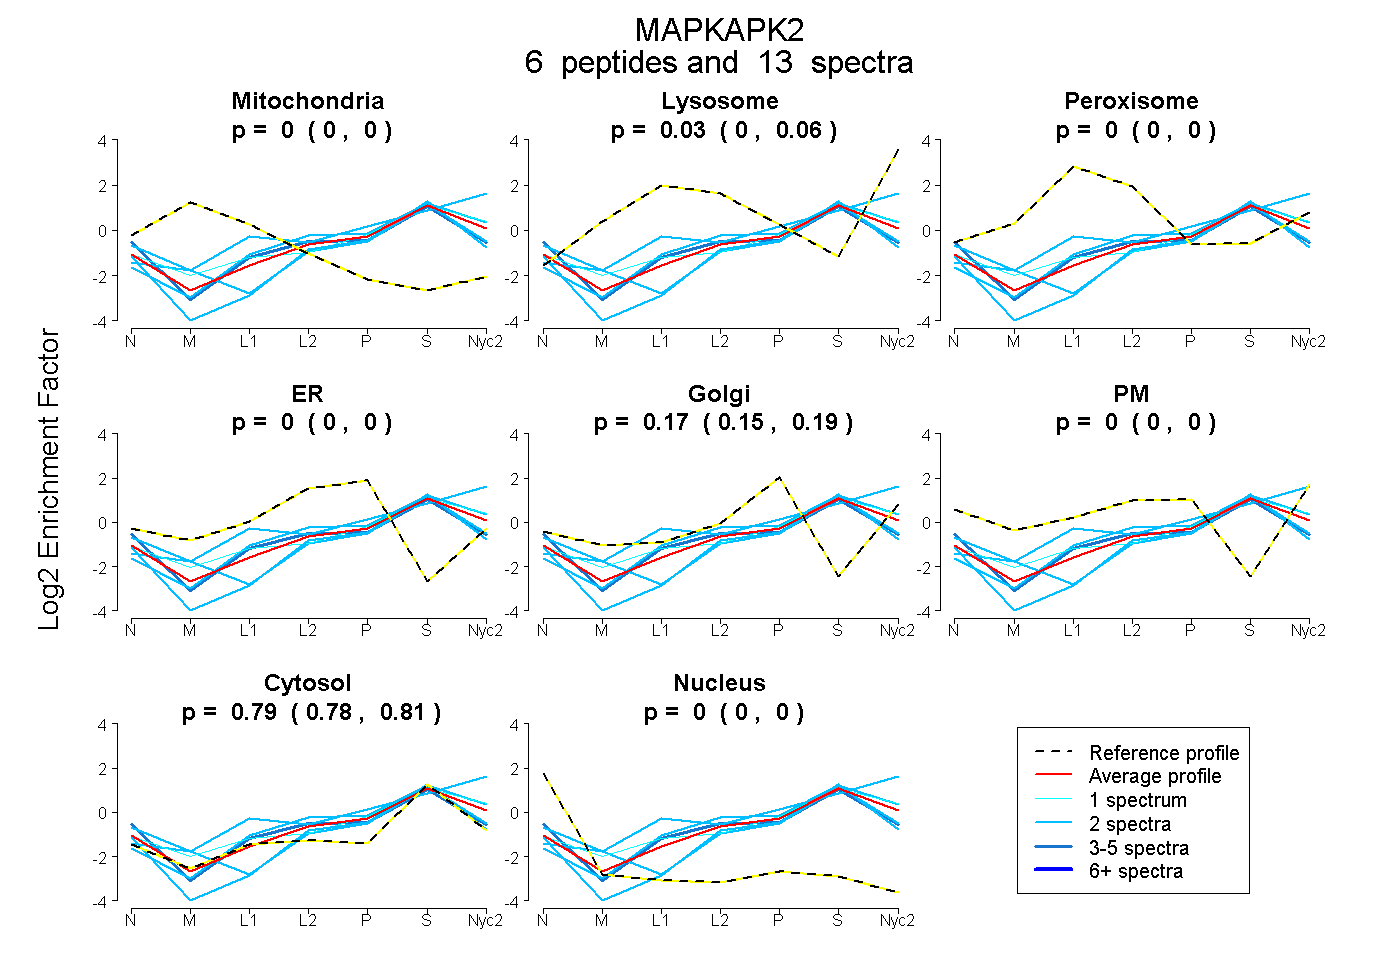
0.000 | 0.000
0.000 | 0.063
0.000 | 0.000
0.000 | 0.000
0.147 | 0.195
0.000 | 0.000
0.776 | 0.807
0.000 | 0.000
2peptides
spectra
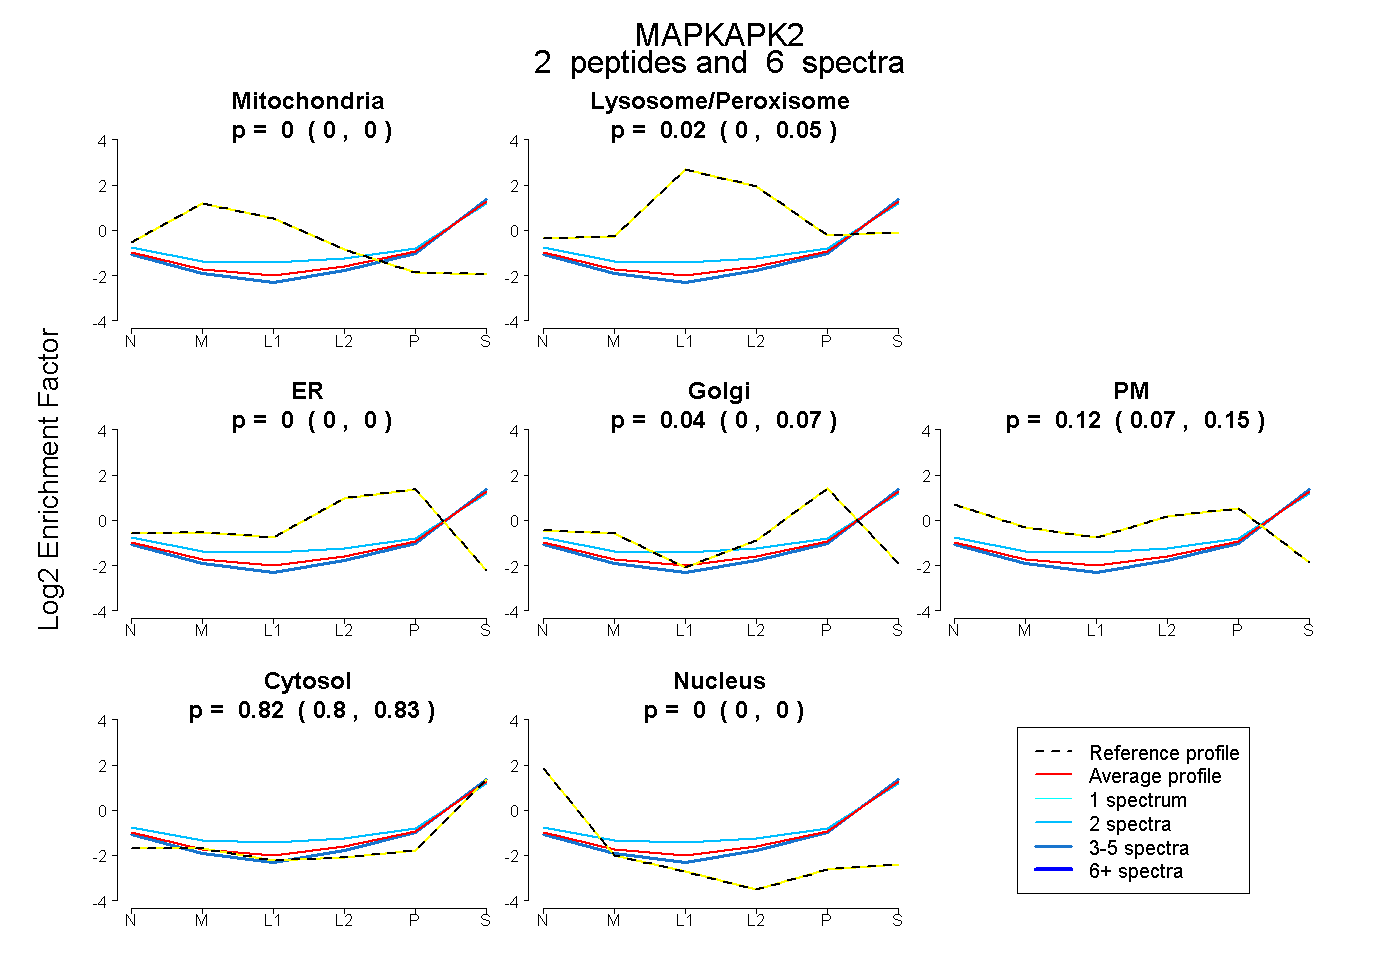
0.000 | 0.000
0.000 | 0.050
0.000 | 0.000
0.004 | 0.068
0.071 | 0.151
0.805 | 0.830
0.000 | 0.000
5peptides
spectra
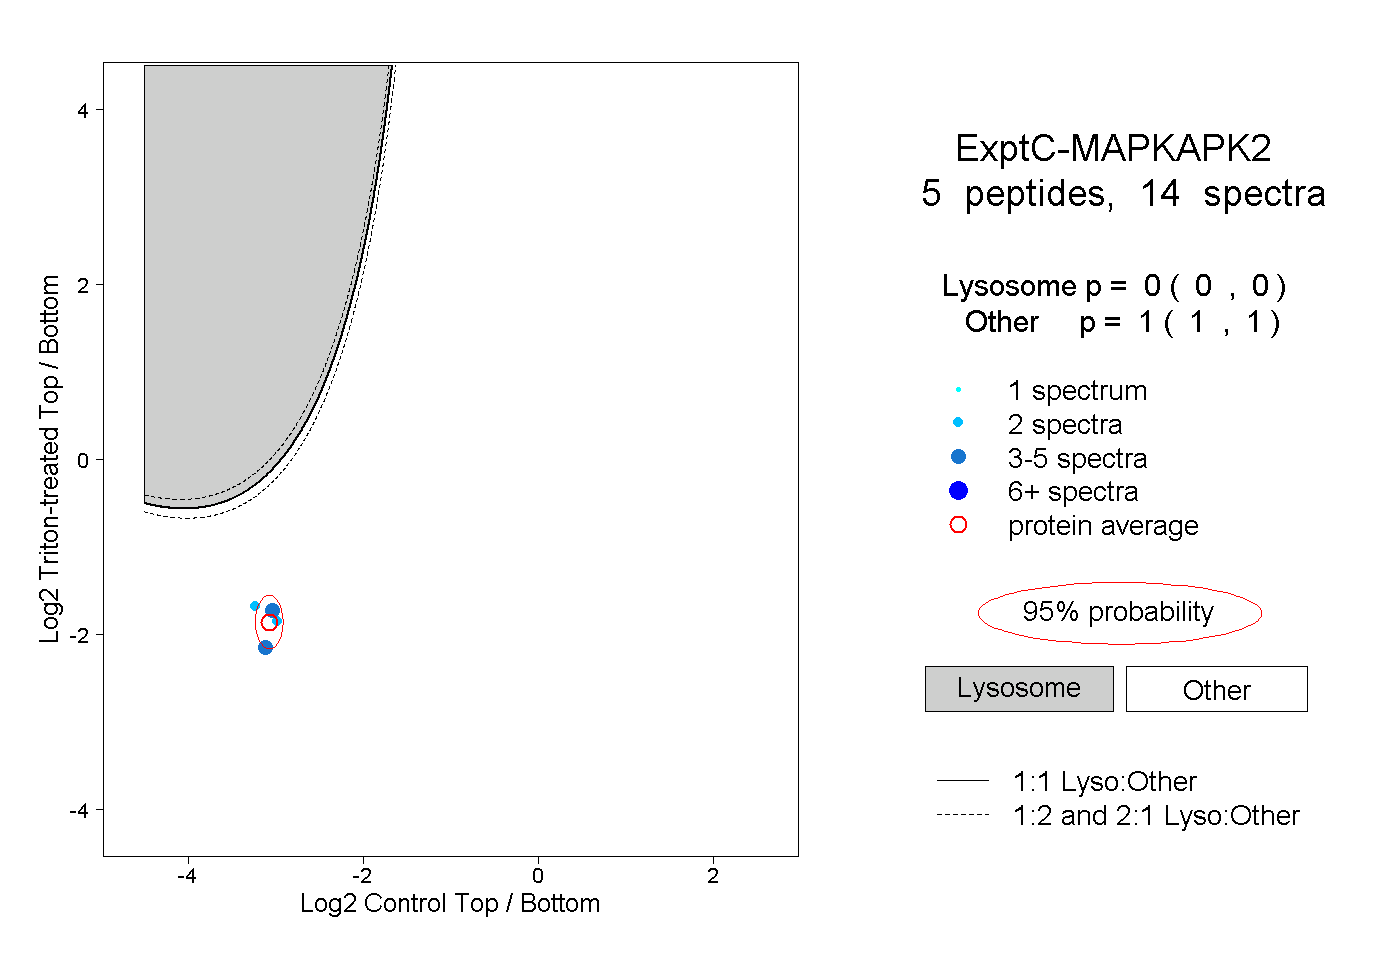
0.000 | 0.000
1.000 | 1.000
1peptide
spectra
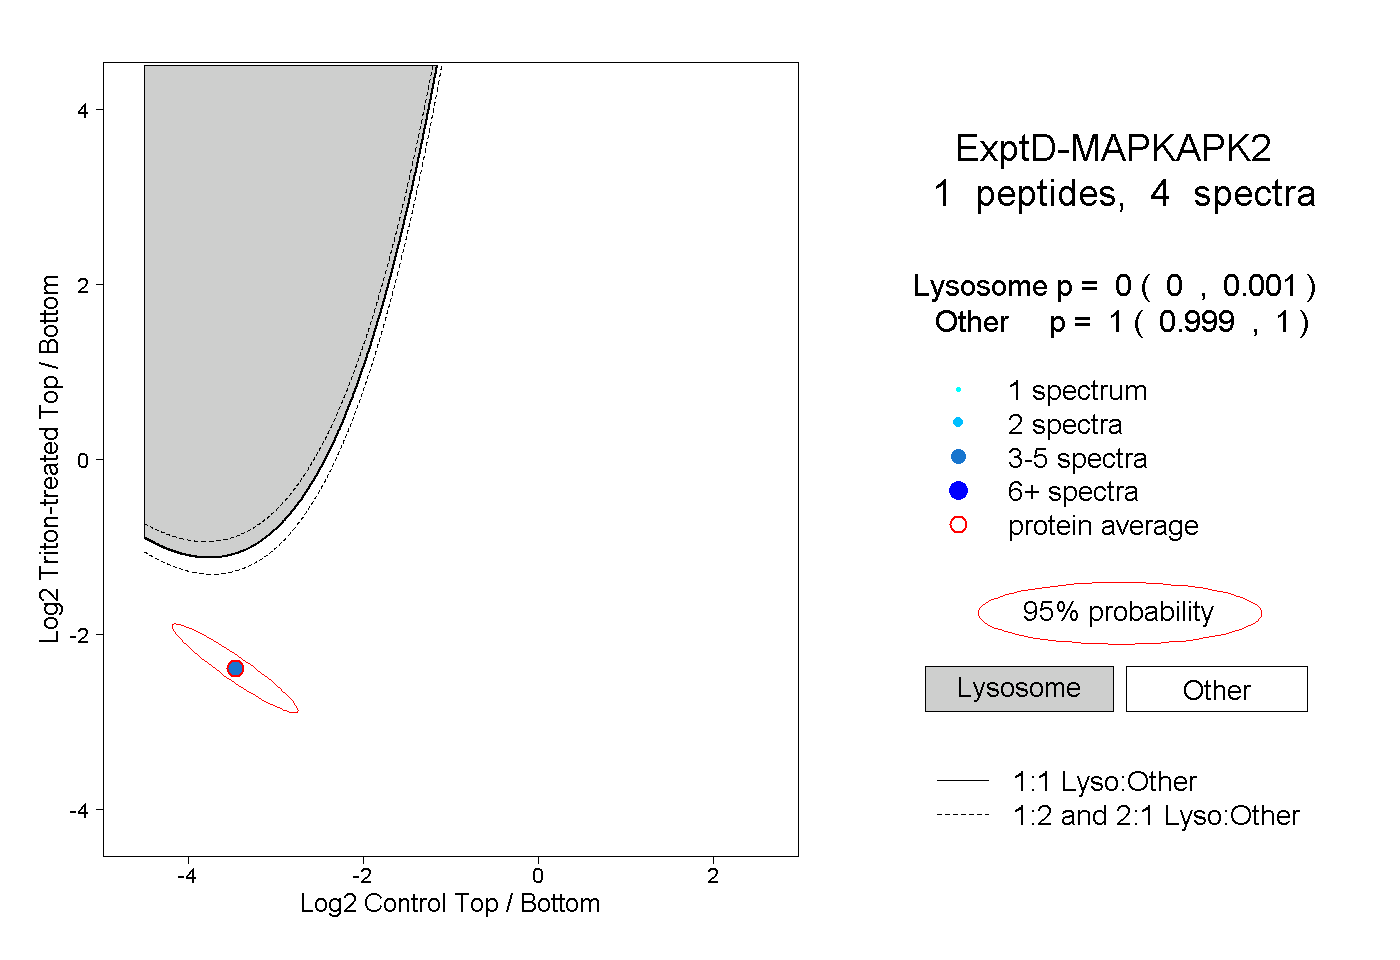
0.000 | 0.001
0.999 | 1.000