 2
2peptides
spectra
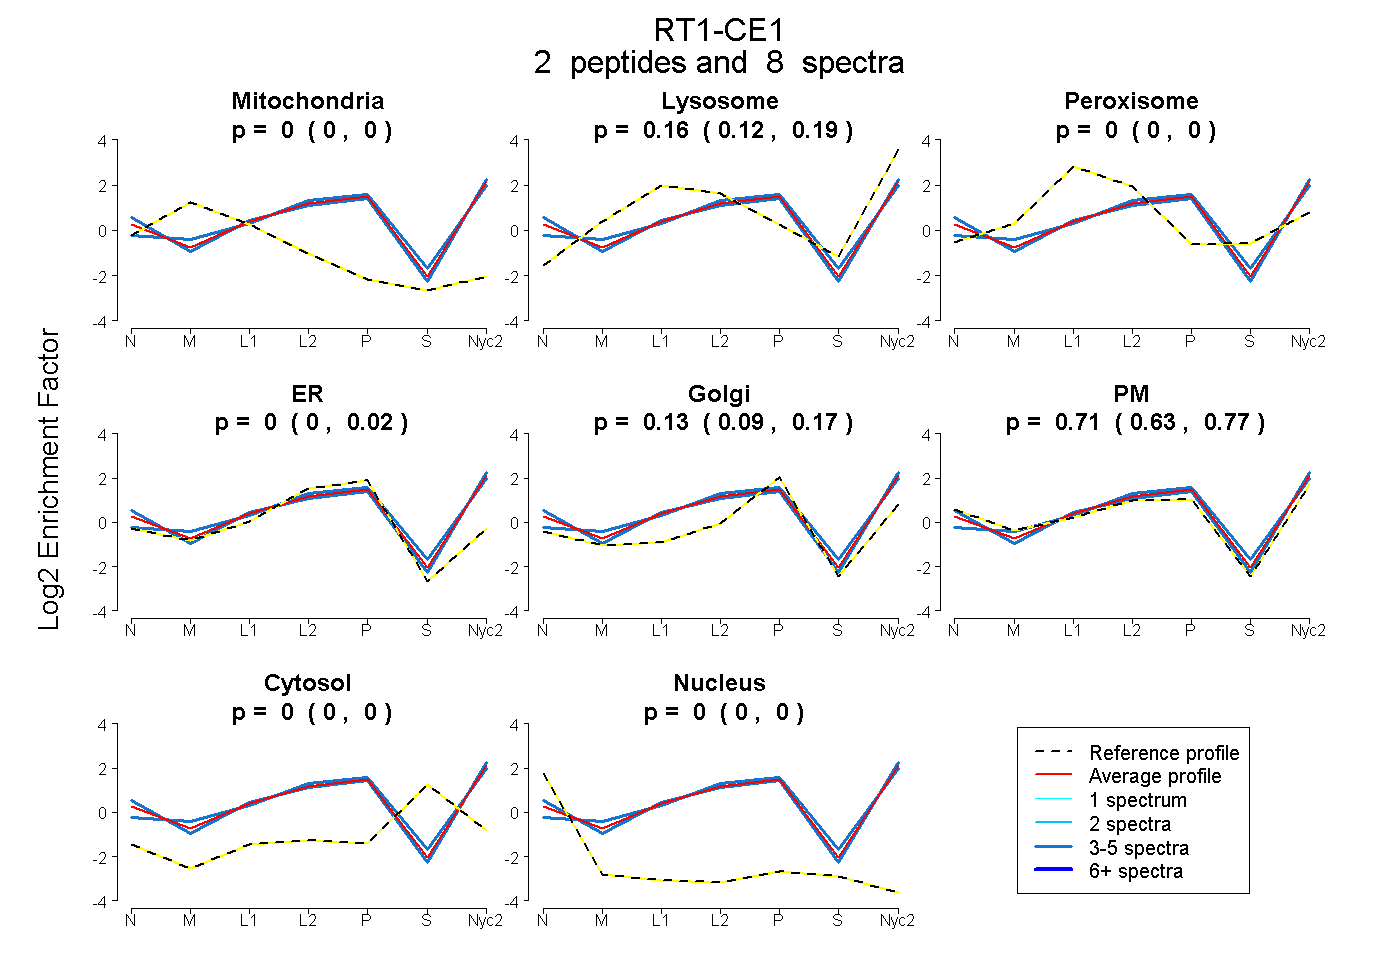
0.000 | 0.000
0.122 | 0.189
0.000 | 0.000
0.000 | 0.019
0.085 | 0.171
0.627 | 0.769
0.000 | 0.000
0.000 | 0.000
2peptides
spectra
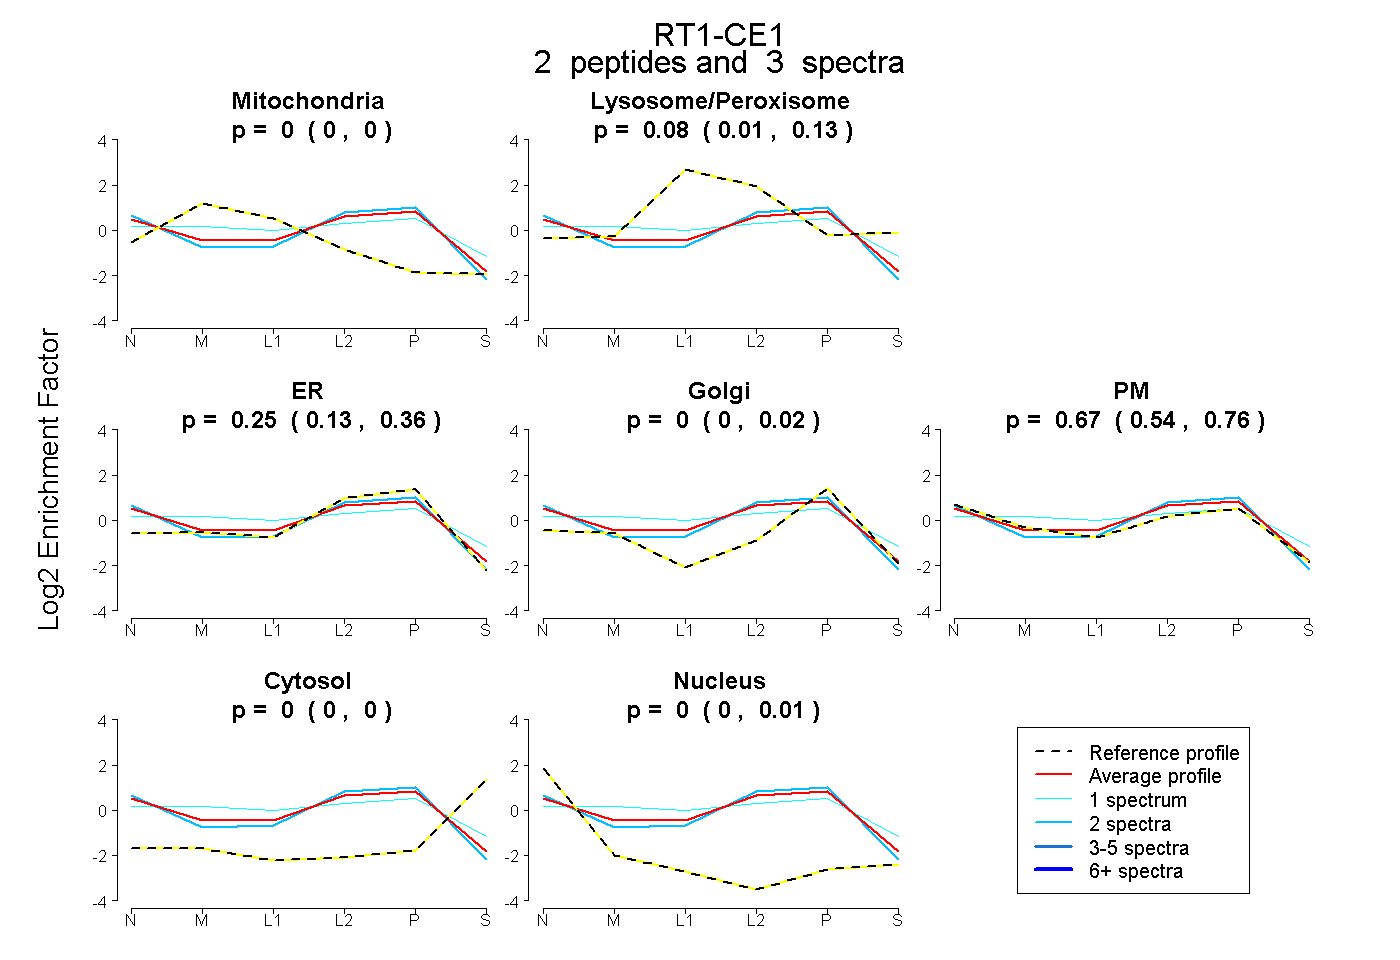
0.000 | 0.000
0.012 | 0.133
0.127 | 0.362
0.000 | 0.021
0.538 | 0.761
0.000 | 0.000
0.000 | 0.007
2peptides
spectra
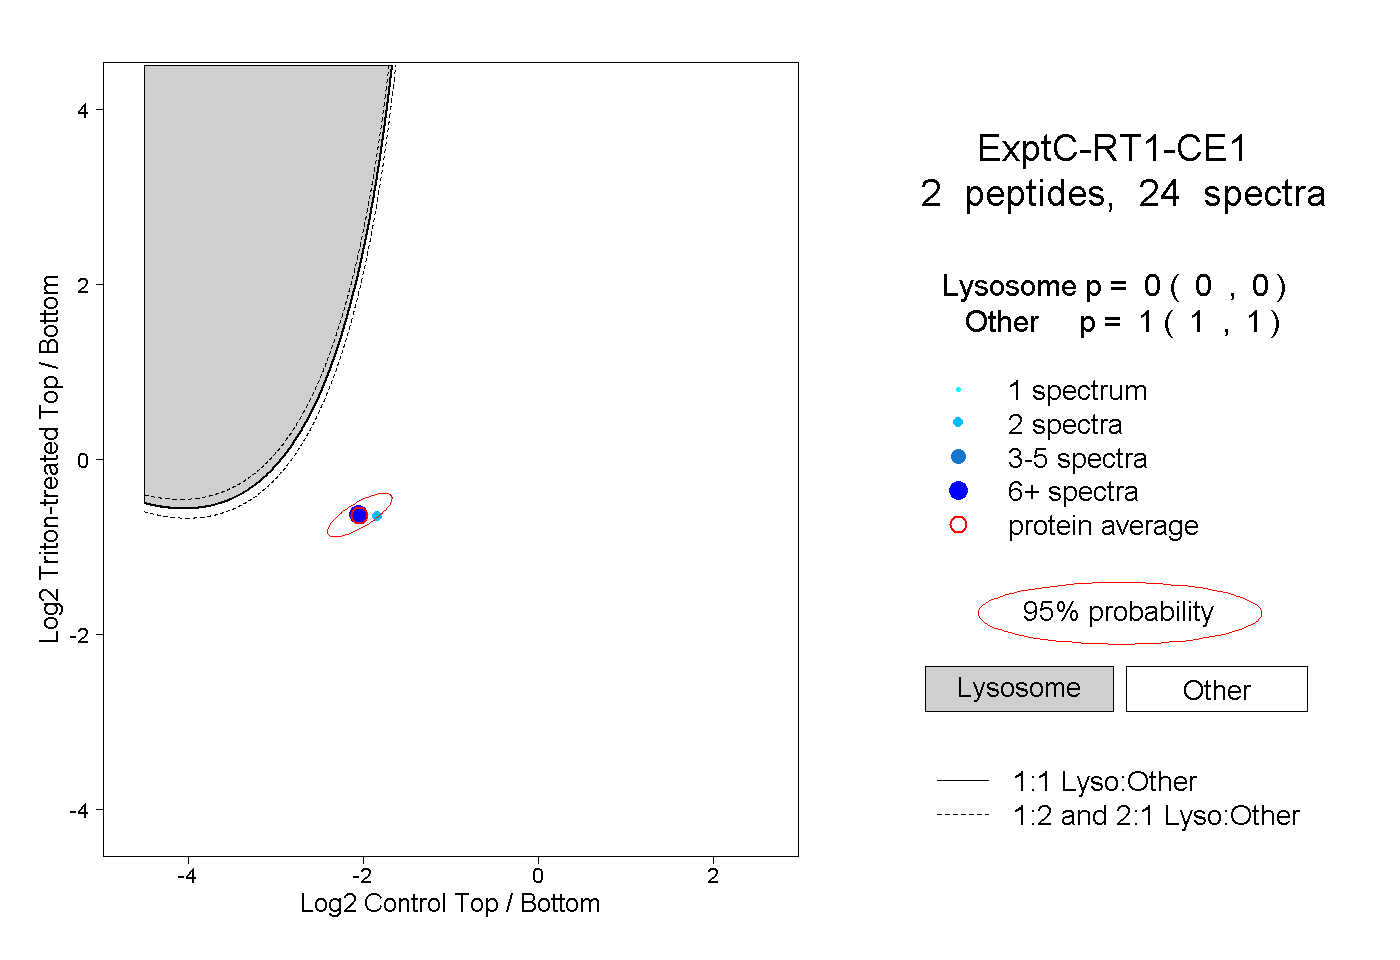
0.000 | 0.000
1.000 | 1.000
1peptide
spectra
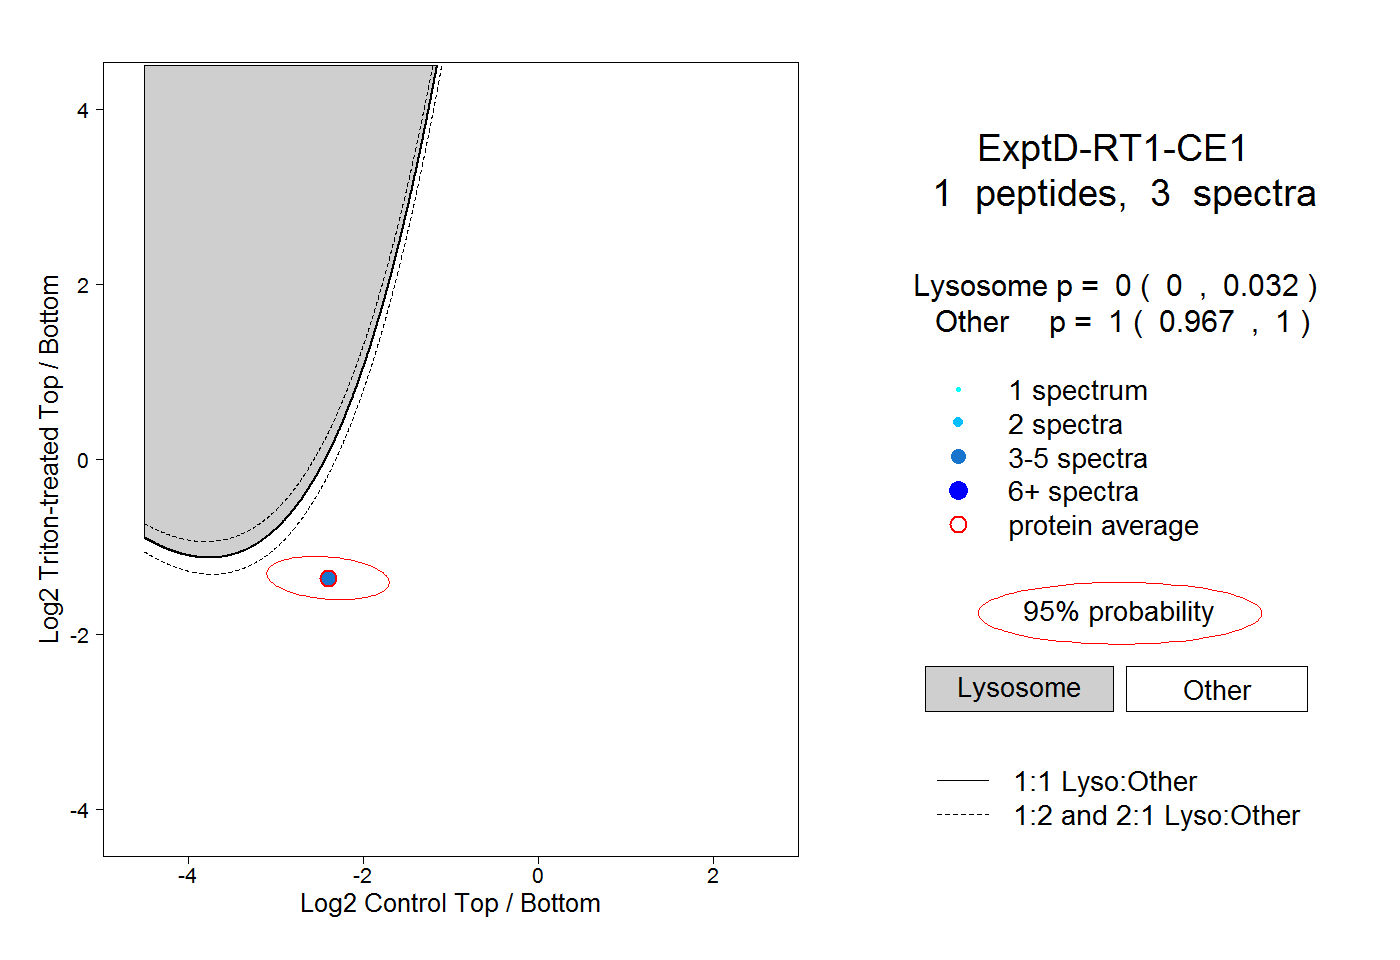
0.000 | 0.032
0.967 | 1.000