 4
4peptides
spectra
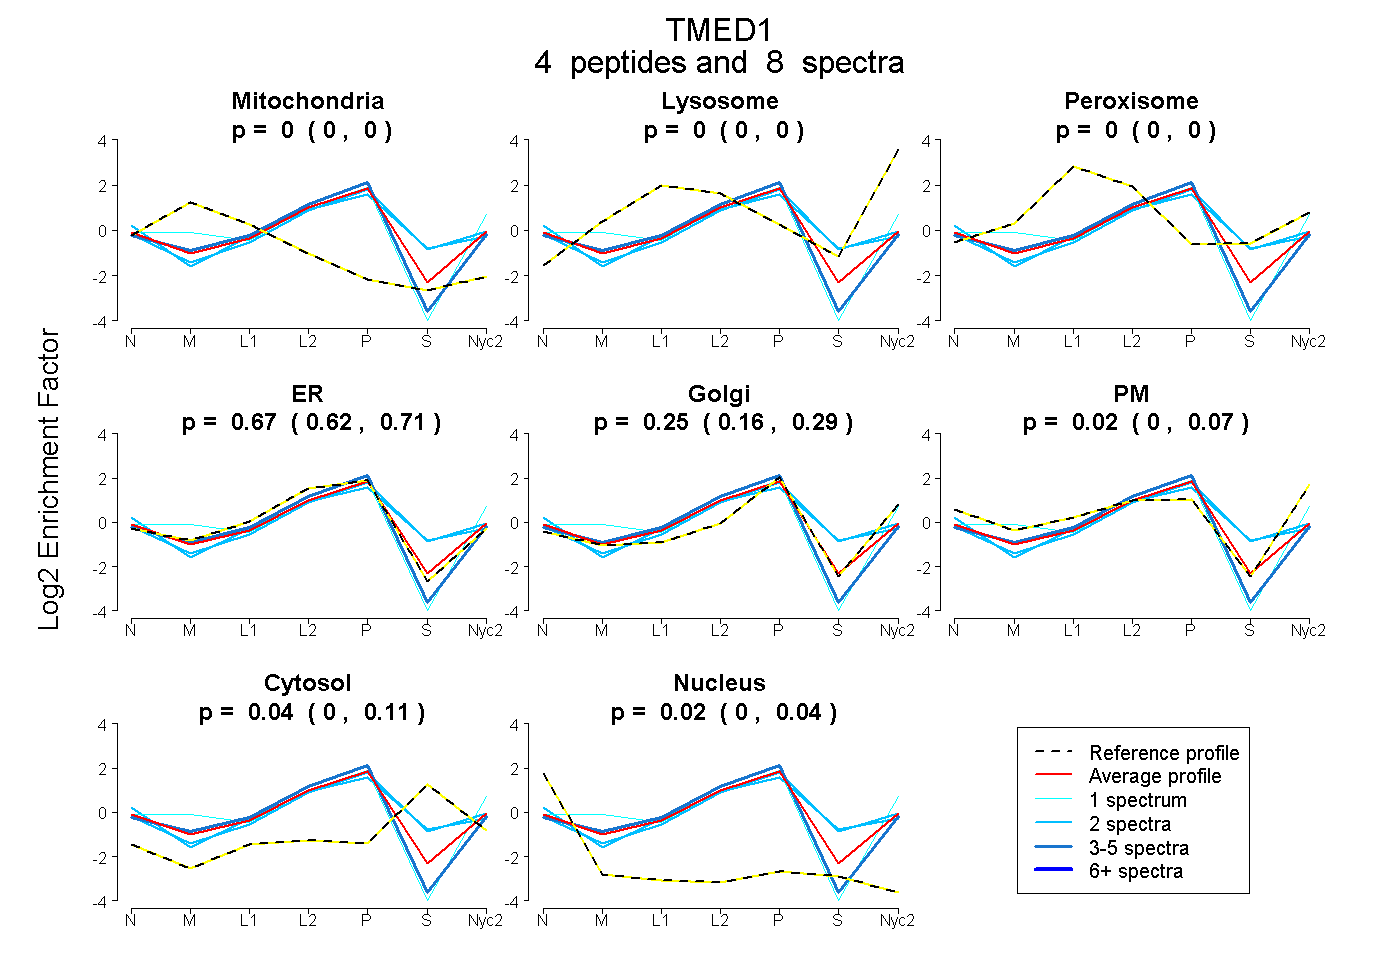
0.000 | 0.000
0.000 | 0.000
0.000 | 0.000
0.618 | 0.715
0.165 | 0.291
0.000 | 0.069
0.000 | 0.111
0.000 | 0.042
3peptides
spectra
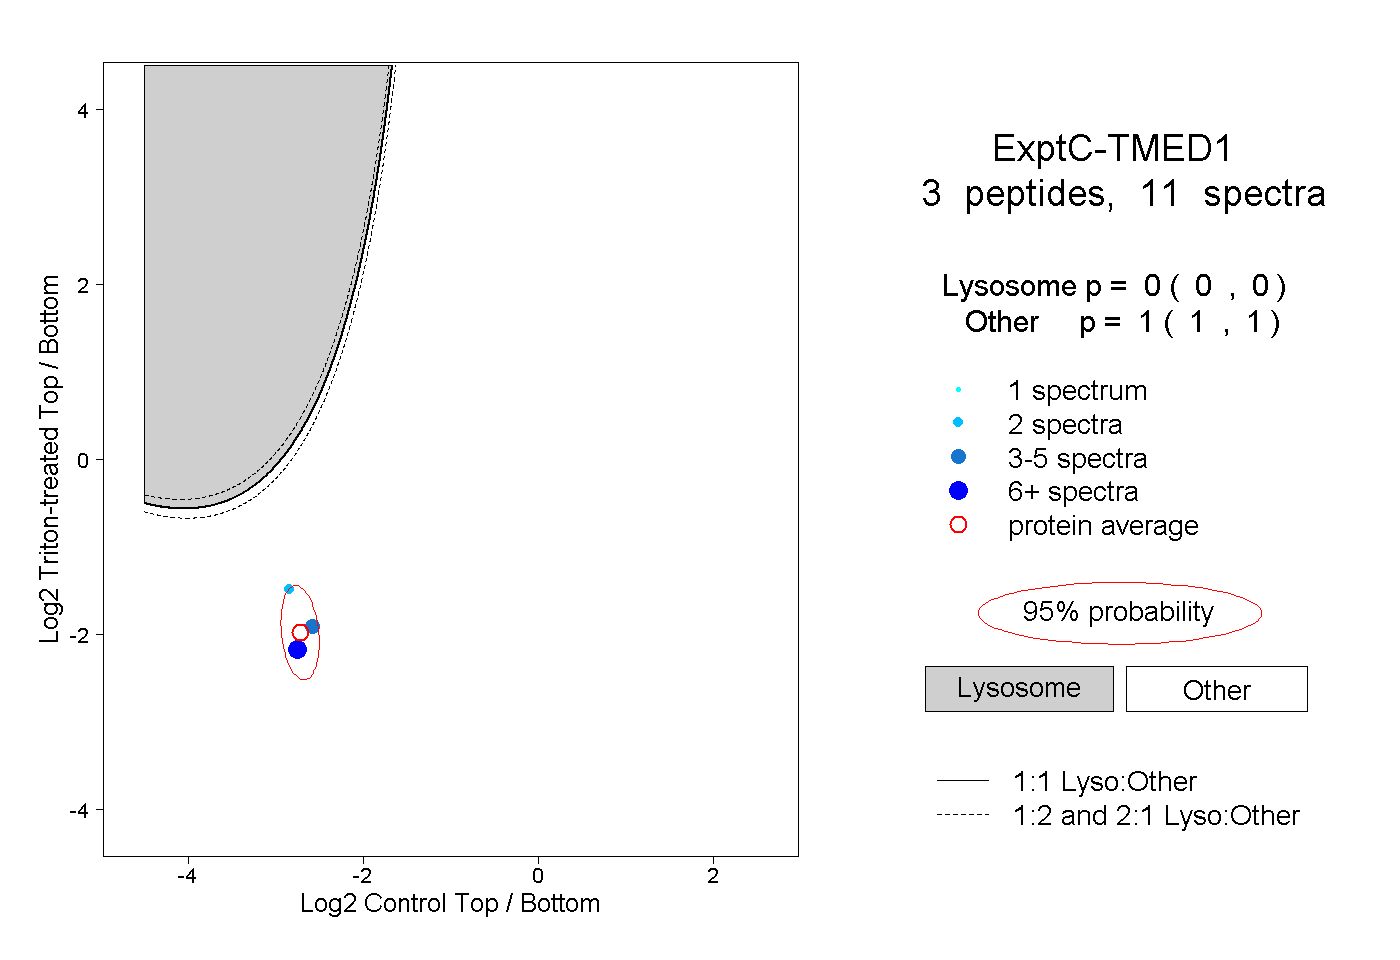
0.000 | 0.000
1.000 | 1.000
1peptide
spectra
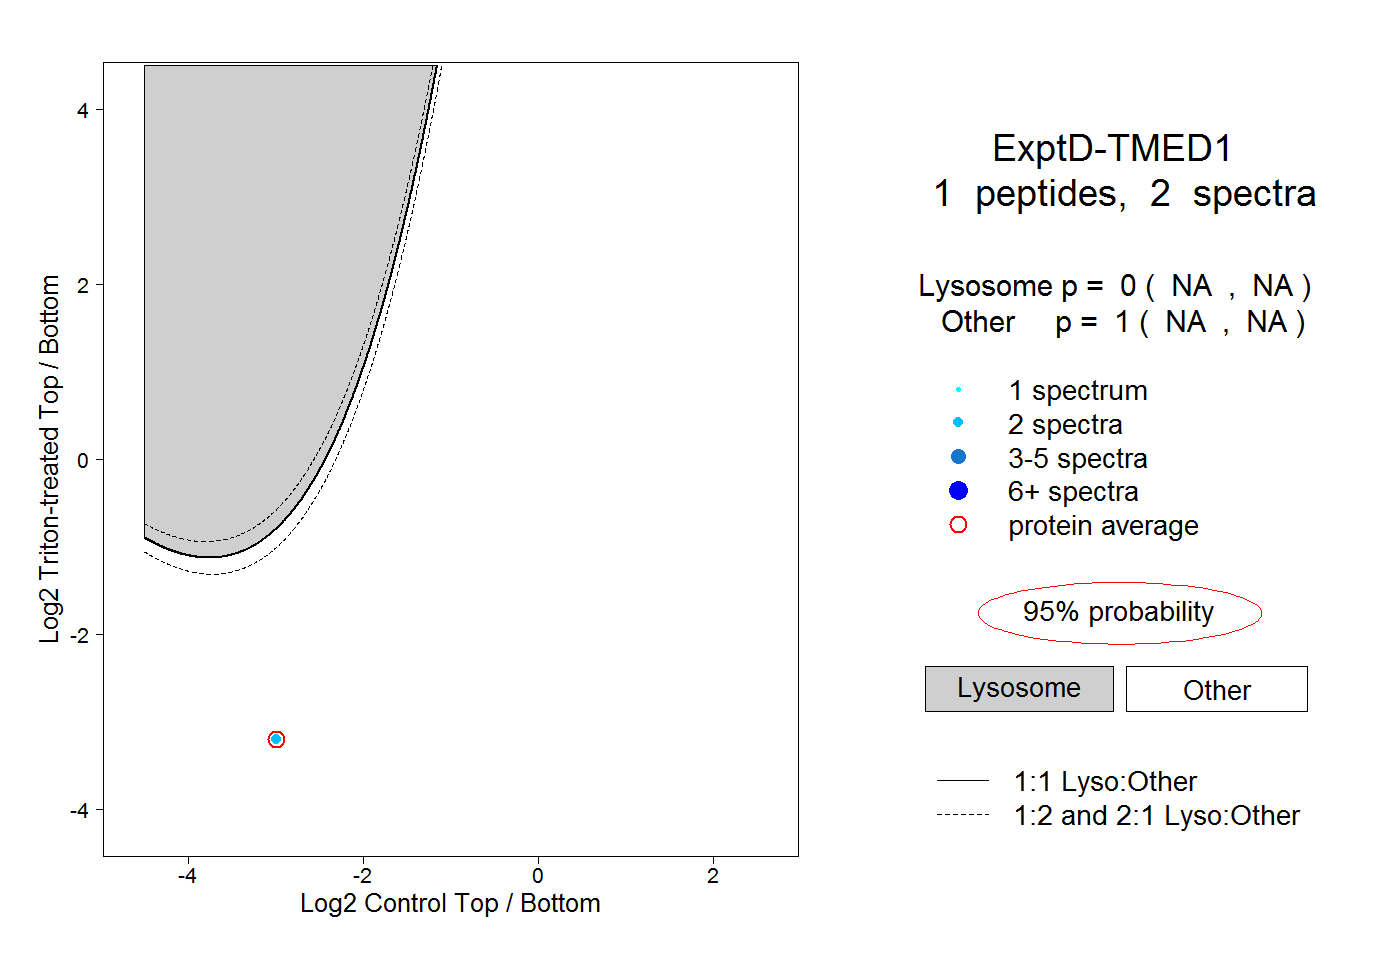
NA | NA
NA | NA