 3
3peptides
spectra
0.000 | 0.000
0.000 | 0.131
0.000 | 0.105
0.000 | 0.180
0.000 | 0.176
0.000 | 0.165
0.638 | 0.775
0.000 | 0.000
2peptides
spectra
NA | NA
NA | NA
| Plot | Mito | Lyso | Perox | ER | Golgi | PM | Cytosol | Nucleus | |||||
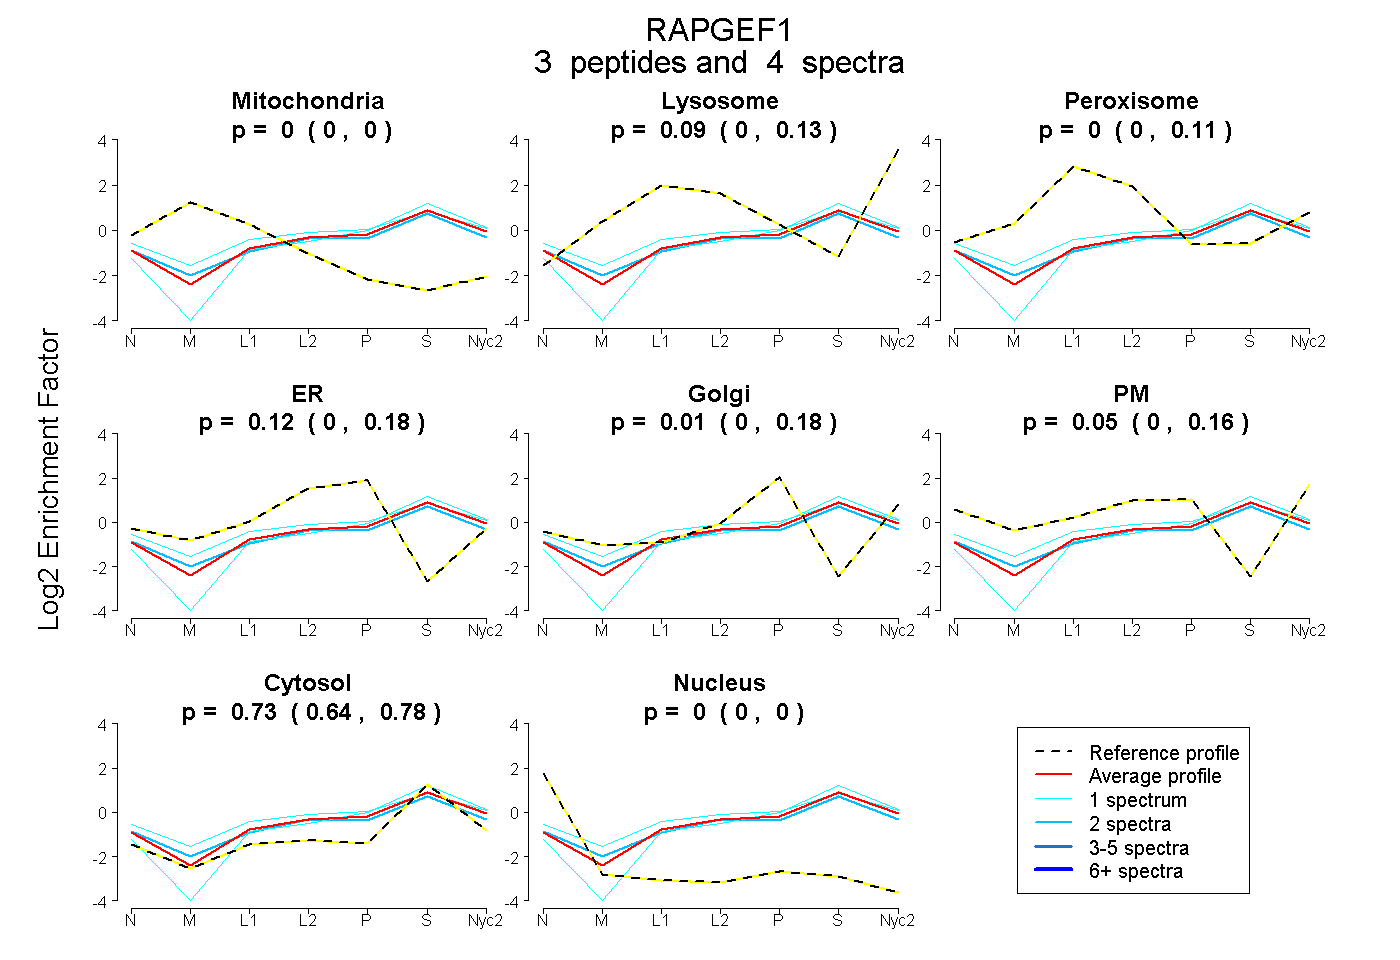
| Expt A |
3 peptides |
4 spectra |
|
0.000 0.000 | 0.000 |
0.090 0.000 | 0.131 |
0.000 0.000 | 0.105 |
0.118 0.000 | 0.180 |
0.012 0.000 | 0.176 |
0.052 0.000 | 0.165 |
0.728 0.638 | 0.775 |
0.000 0.000 | 0.000 |
||
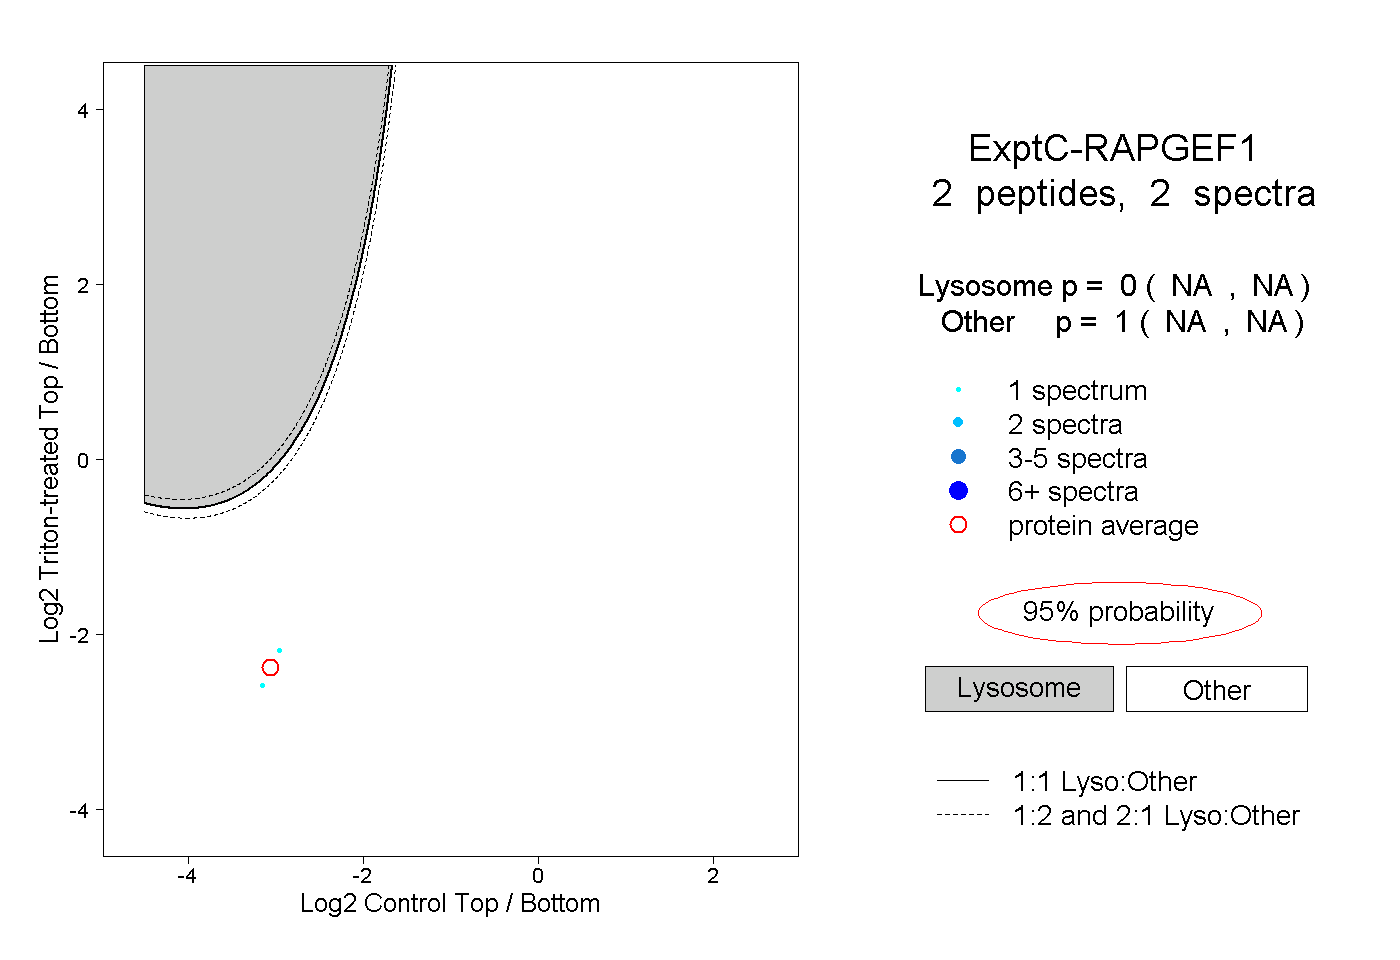
| Plot | Lyso | Other | |||||||||||
| Expt C |
2 peptides |
2 spectra |
|
0.000 NA | NA |
1.000 NA | NA |
| 1 spectrum, AVLDGVK | 0.000 | 1.000 | ||||||||
| 1 spectrum, SAVSQTTDSSGCR | 0.000 | 1.000 |