 3
3peptides
spectra
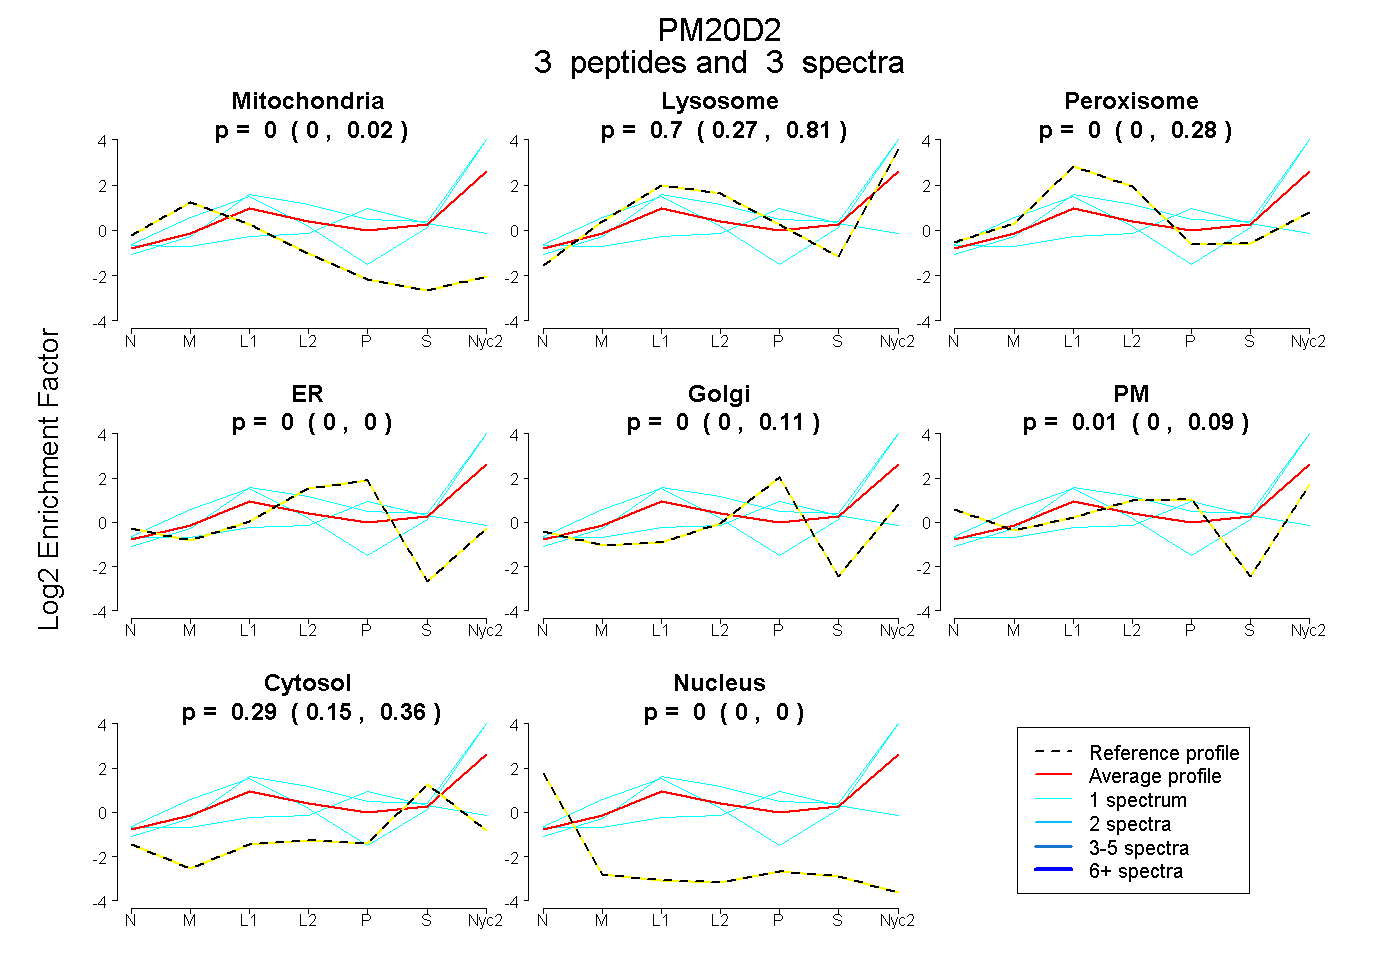
0.000 | 0.015
0.275 | 0.815
0.000 | 0.284
0.000 | 0.000
0.000 | 0.106
0.000 | 0.089
0.152 | 0.355
0.000 | 0.000
5peptides
spectra
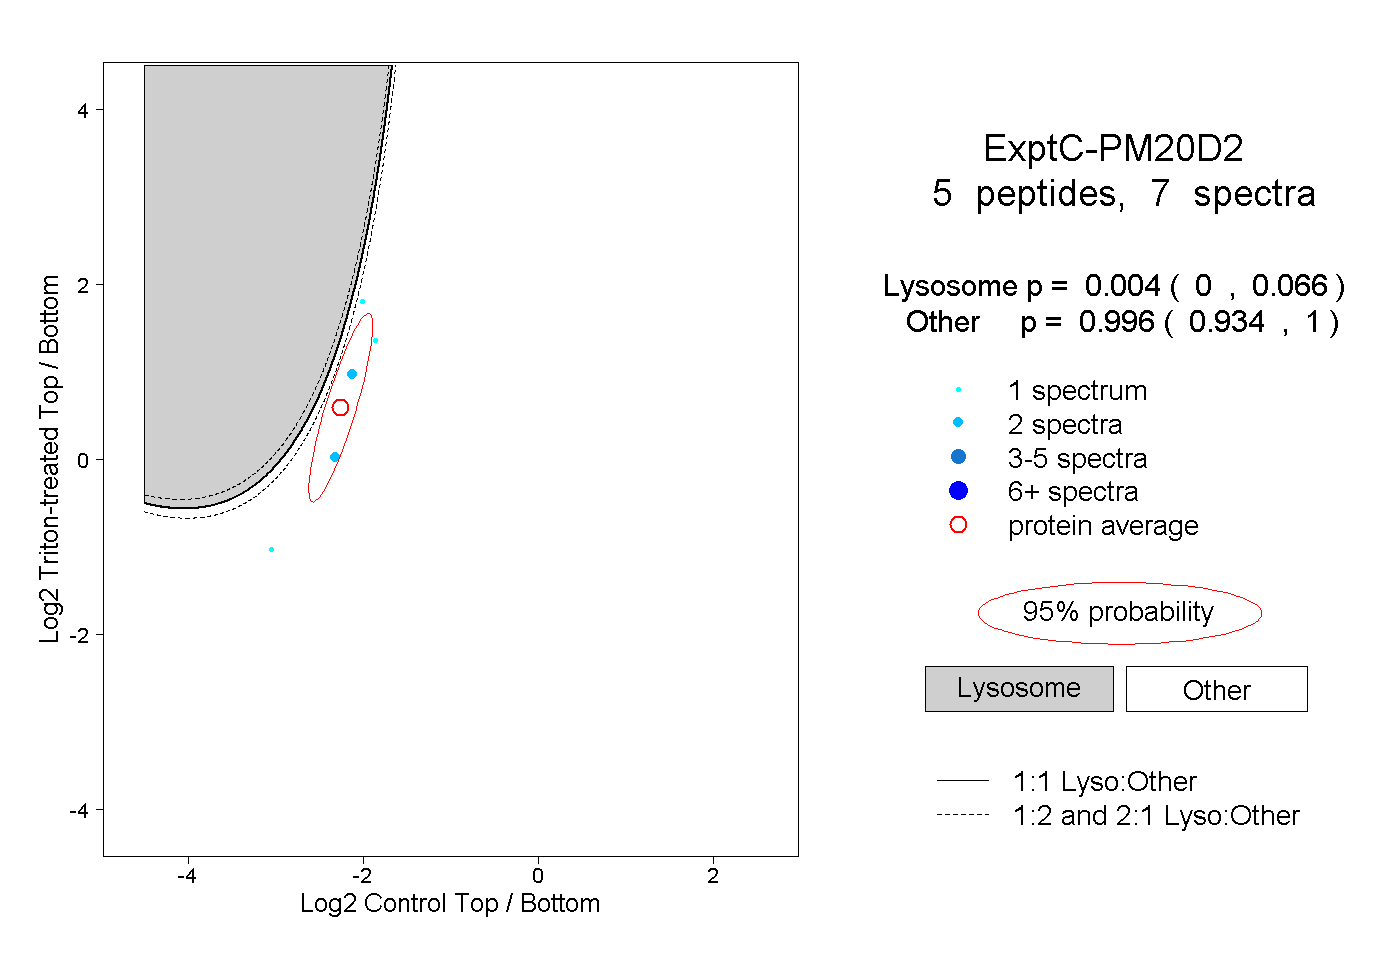
0.000 | 0.066
0.934 | 1.000
| Plot | Mito | Lyso | Perox | ER | Golgi | PM | Cytosol | Nucleus | |||||
| Expt A |
3 peptides |
3 spectra |
|
0.000 0.000 | 0.015 |
0.699 0.275 | 0.815 |
0.000 0.000 | 0.284 |
0.000 0.000 | 0.000 |
0.000 0.000 | 0.106 |
0.006 0.000 | 0.089 |
0.294 0.152 | 0.355 |
0.000 0.000 | 0.000 |
||
| Plot | Lyso | Other | |||||||||||
| Expt C |
5 peptides |
7 spectra |
|
0.004 0.000 | 0.066 |
0.996 0.934 | 1.000 |