 10
10peptides
spectra
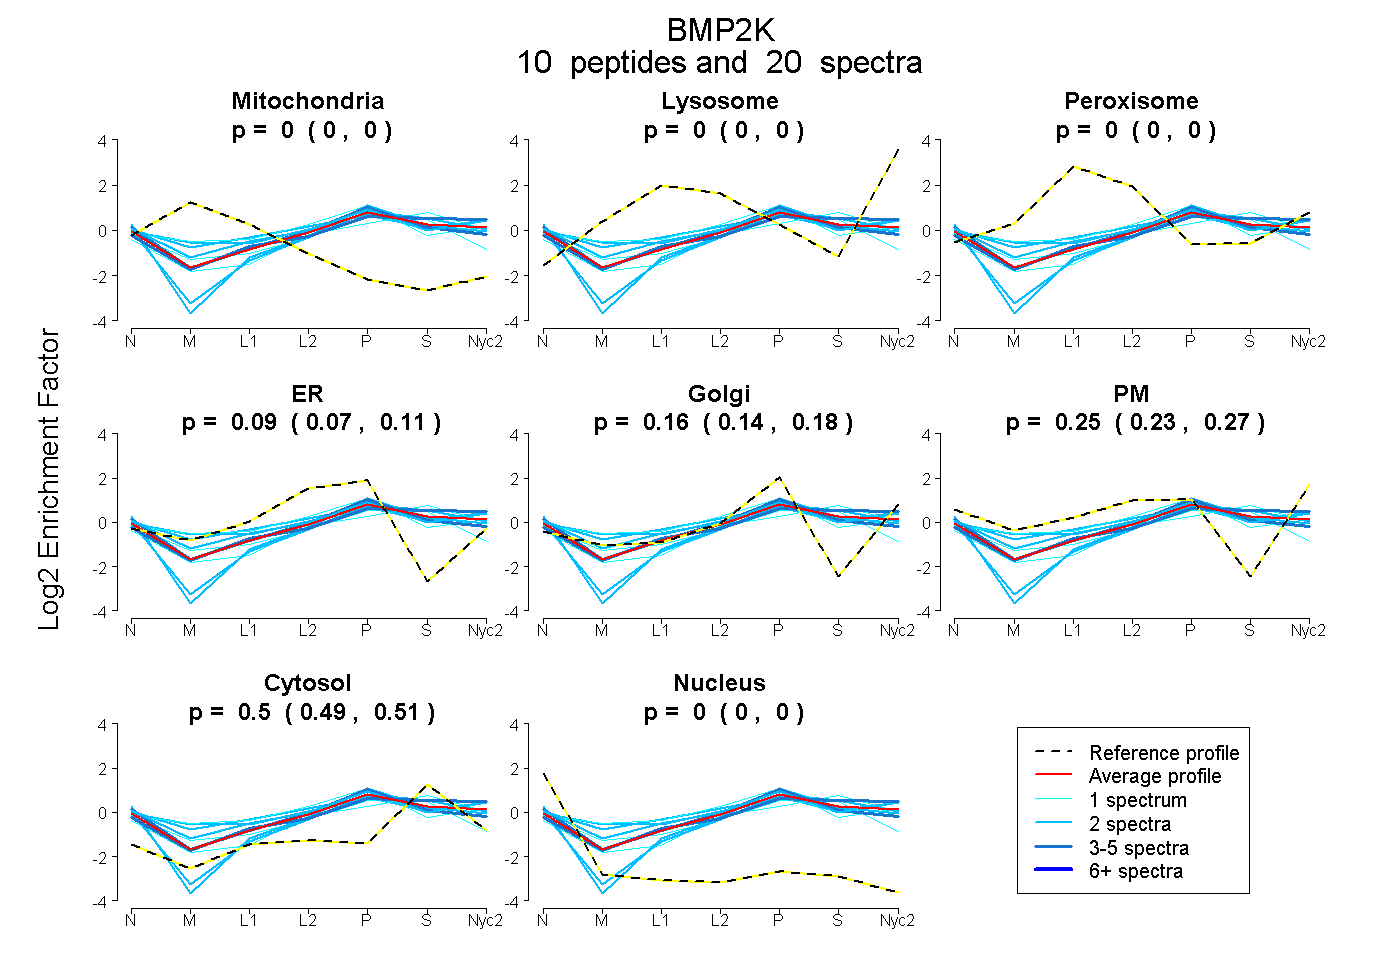
0.000 | 0.000
0.000 | 0.000
0.000 | 0.000
0.066 | 0.108
0.138 | 0.182
0.226 | 0.273
0.490 | 0.505
0.000 | 0.000
| Plot | Mito | Lyso | Perox | ER | Golgi | PM | Cytosol | Nucleus | |||||
| Expt A |
10 peptides |
20 spectra |
|
0.000 0.000 | 0.000 |
0.000 0.000 | 0.000 |
0.000 0.000 | 0.000 |
0.088 0.066 | 0.108 |
0.163 0.138 | 0.182 |
0.251 0.226 | 0.273 |
0.498 0.490 | 0.505 |
0.000 0.000 | 0.000 |
| 1 spectrum, ADIWALGCLLYK | 0.000 | 0.000 | 0.000 | 0.356 | 0.044 | 0.007 | 0.593 | 0.000 | ||
| 2 spectra, VLQQLQQGDWR | 0.000 | 0.000 | 0.069 | 0.000 | 0.229 | 0.313 | 0.389 | 0.000 | ||
| 3 spectra, YTTLSYR | 0.000 | 0.038 | 0.000 | 0.000 | 0.149 | 0.277 | 0.536 | 0.000 | ||
| 1 spectrum, FLNPQK | 0.000 | 0.000 | 0.000 | 0.006 | 0.173 | 0.184 | 0.637 | 0.000 | ||
| 1 spectrum, LGESTPSDK | 0.000 | 0.000 | 0.217 | 0.069 | 0.425 | 0.024 | 0.265 | 0.000 | ||
| 2 spectra, LQQLHLHR | 0.000 | 0.000 | 0.000 | 0.040 | 0.409 | 0.000 | 0.551 | 0.000 | ||
| 2 spectra, DGVNVVEEEIK | 0.000 | 0.000 | 0.146 | 0.000 | 0.142 | 0.334 | 0.378 | 0.000 | ||
| 2 spectra, LTEEELLDR | 0.000 | 0.000 | 0.000 | 0.000 | 0.403 | 0.000 | 0.597 | 0.000 | ||
| 2 spectra, EITIMK | 0.000 | 0.000 | 0.120 | 0.000 | 0.207 | 0.305 | 0.368 | 0.000 | ||
| 4 spectra, TPLIHR | 0.000 | 0.000 | 0.000 | 0.224 | 0.177 | 0.132 | 0.466 | 0.000 |
| Plot | Mito | Lyso or Perox | ER | Golgi | PM | Cytosol | Nucleus | ||||||
| Expt B |
1 peptide |
1 spectrum |
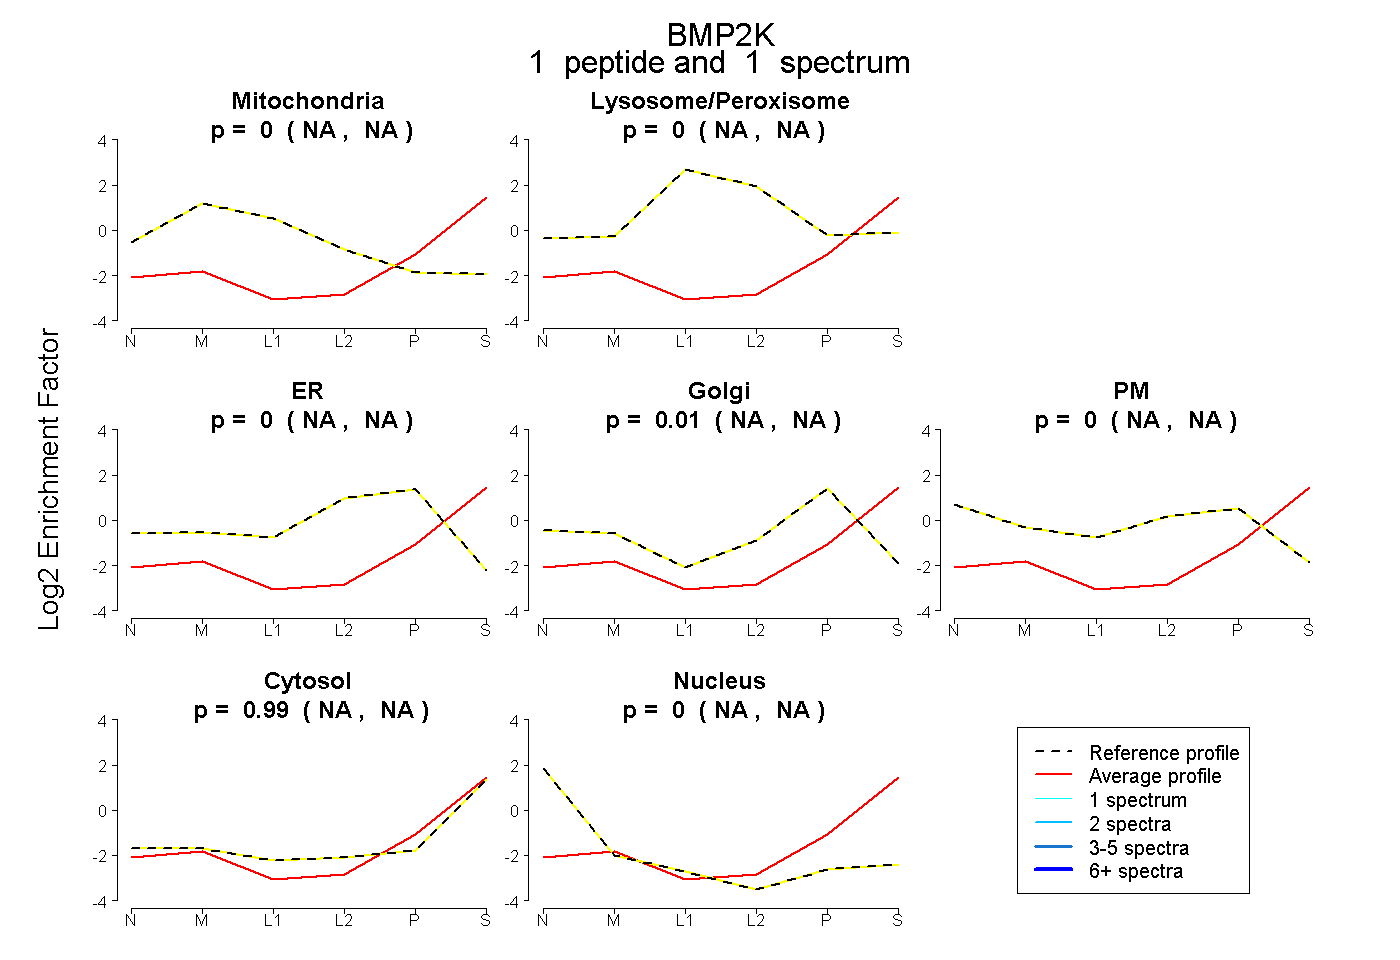 |
0.000 NA | NA |
0.000 NA | NA |
0.000 NA | NA |
0.012 NA | NA |
0.000 NA | NA |
0.988 NA | NA |
0.000 NA | NA |
|||
| Plot | Lyso | Other | |||||||||||
| Expt C |
2 peptides |
4 spectra |
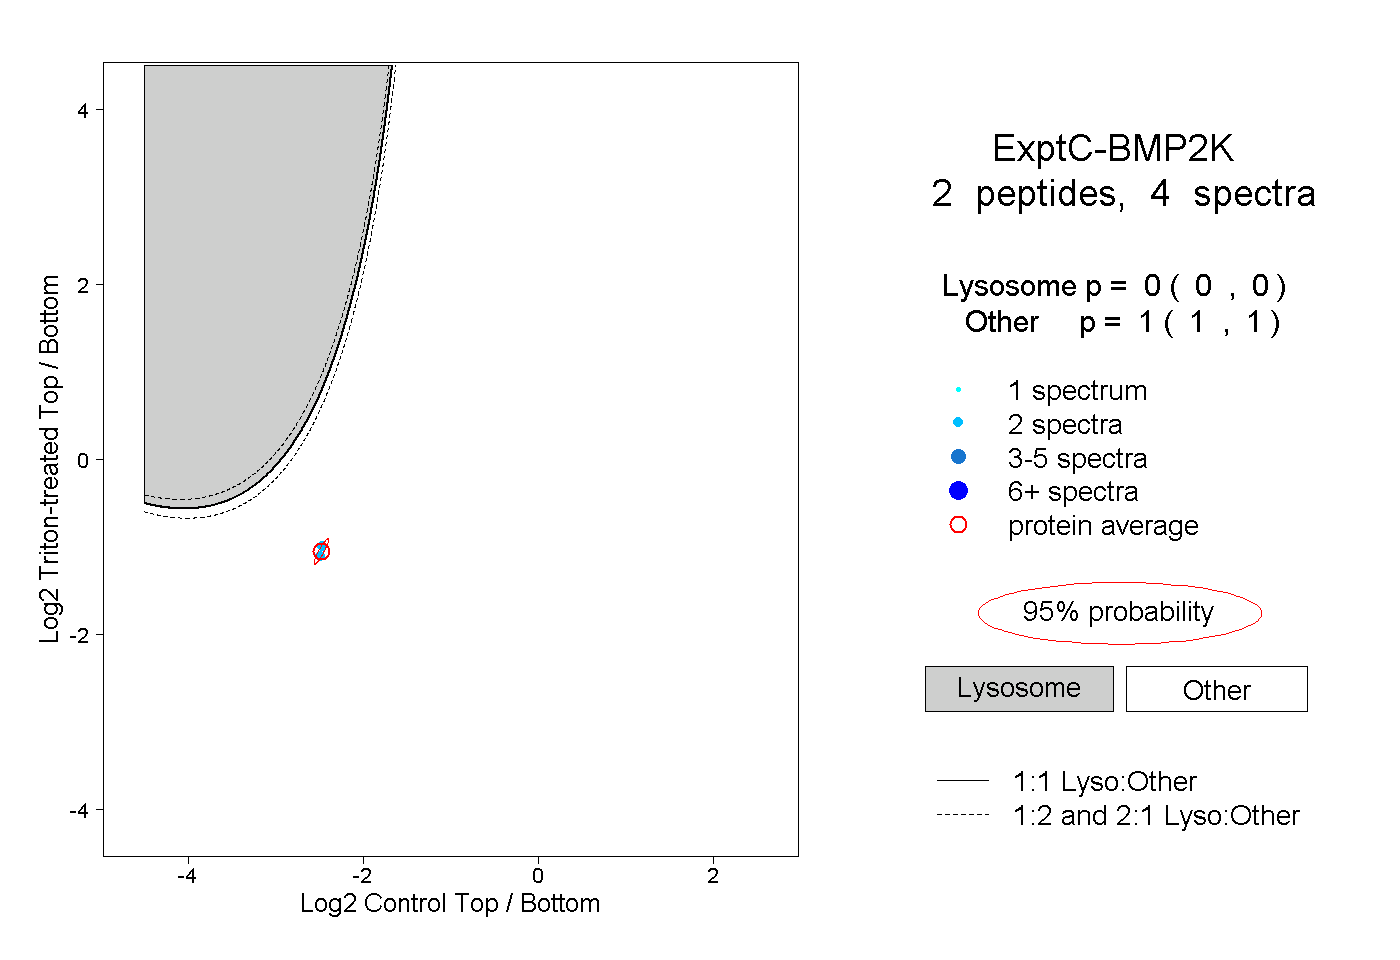 |
0.000 0.000 | 0.000 |
1.000 1.000 | 1.000 |