 12
12peptides
spectra
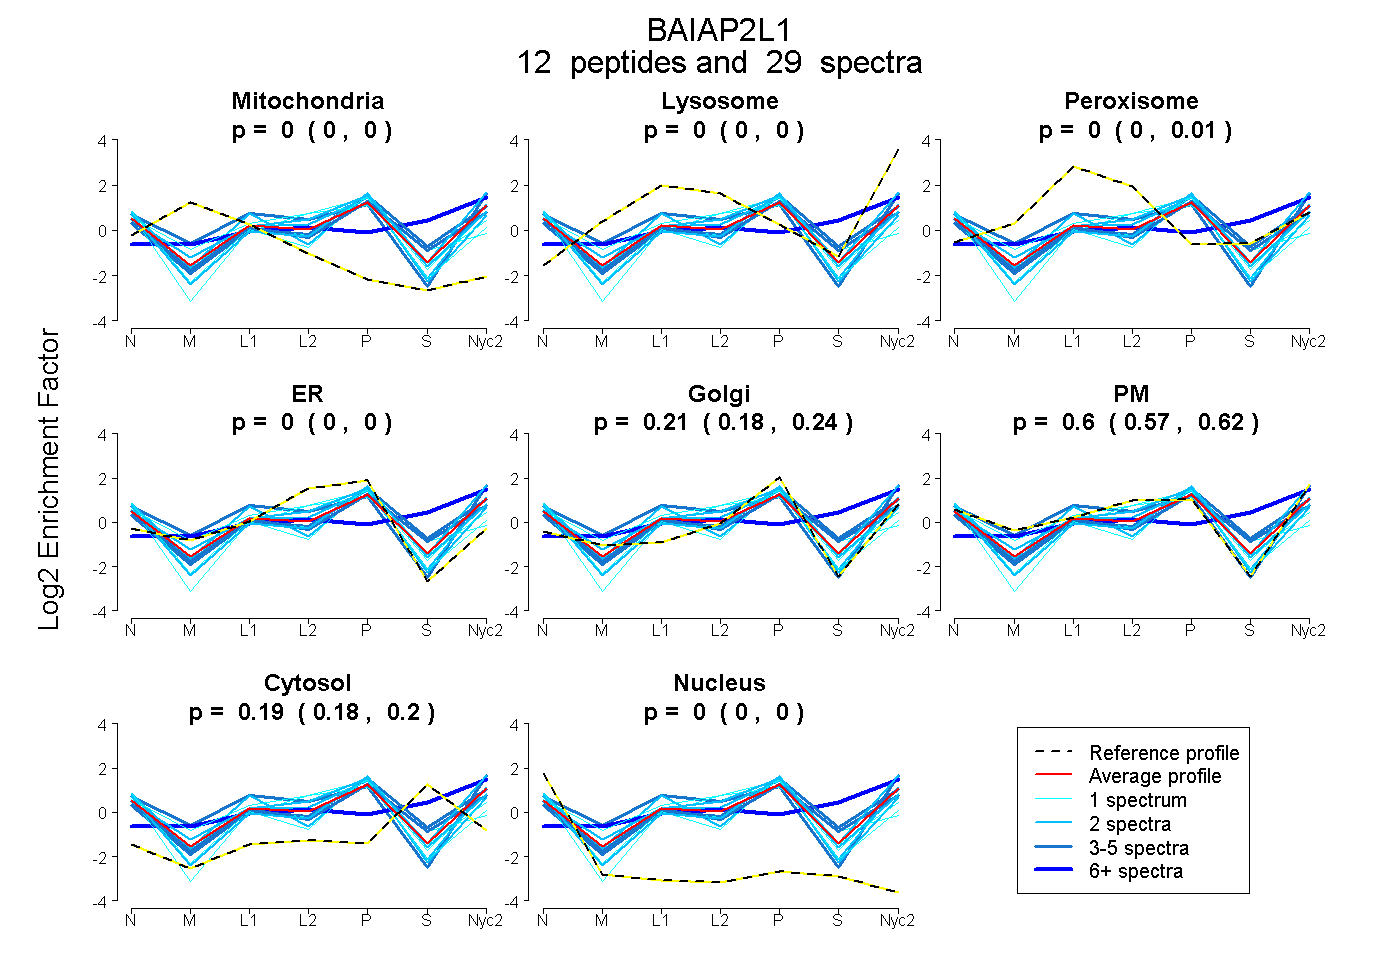
0.000 | 0.000
0.000 | 0.000
0.000 | 0.006
0.000 | 0.000
0.180 | 0.240
0.566 | 0.617
0.177 | 0.203
0.000 | 0.000
3peptides
spectra
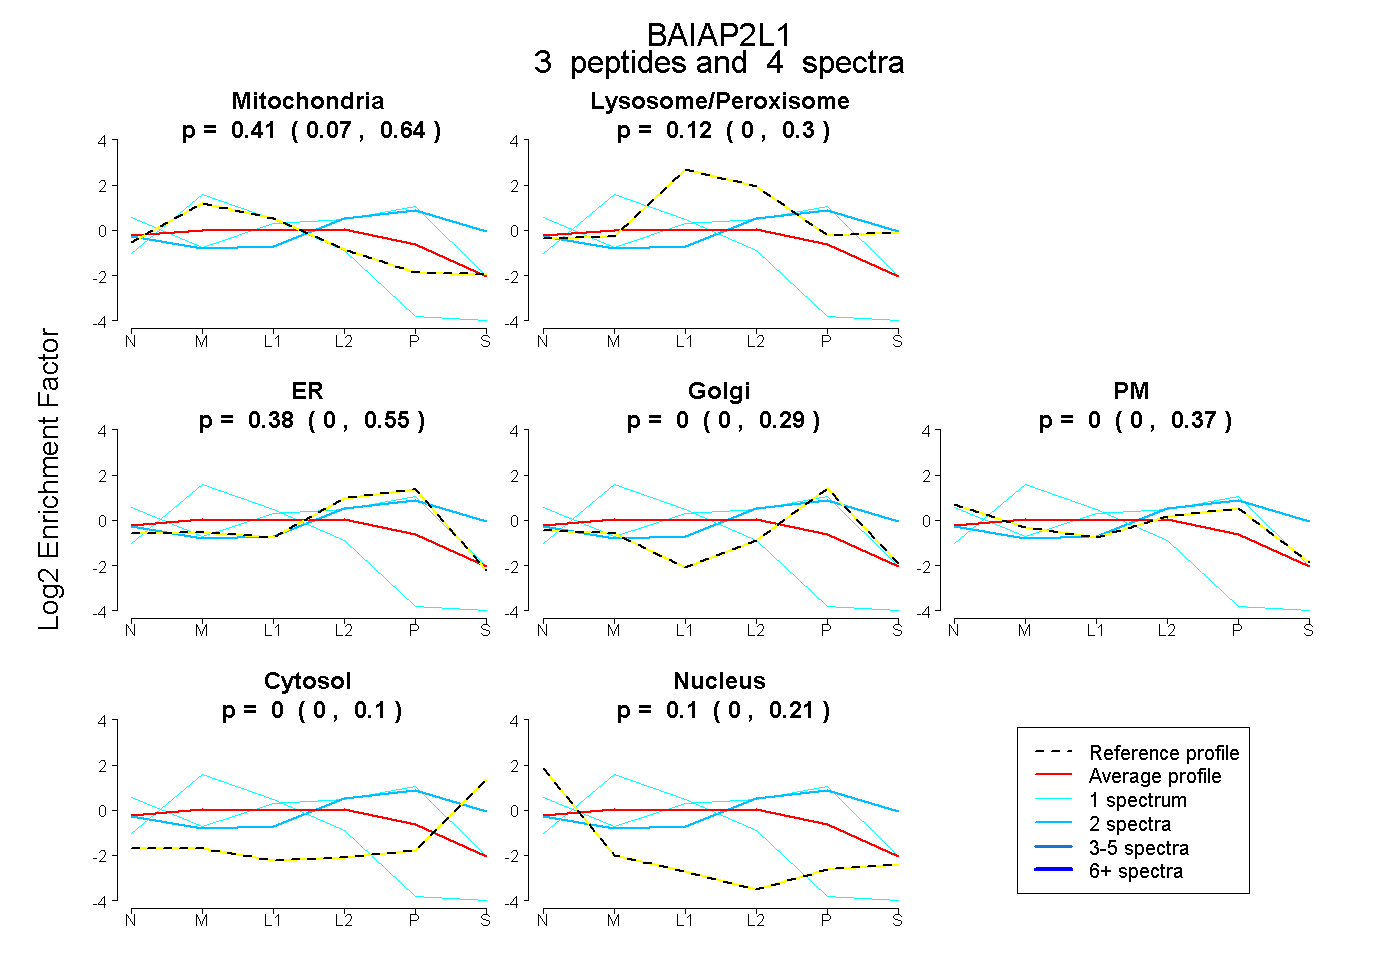
0.071 | 0.643
0.000 | 0.301
0.000 | 0.552
0.000 | 0.290
0.000 | 0.368
0.000 | 0.103
0.000 | 0.206
14peptides
spectra
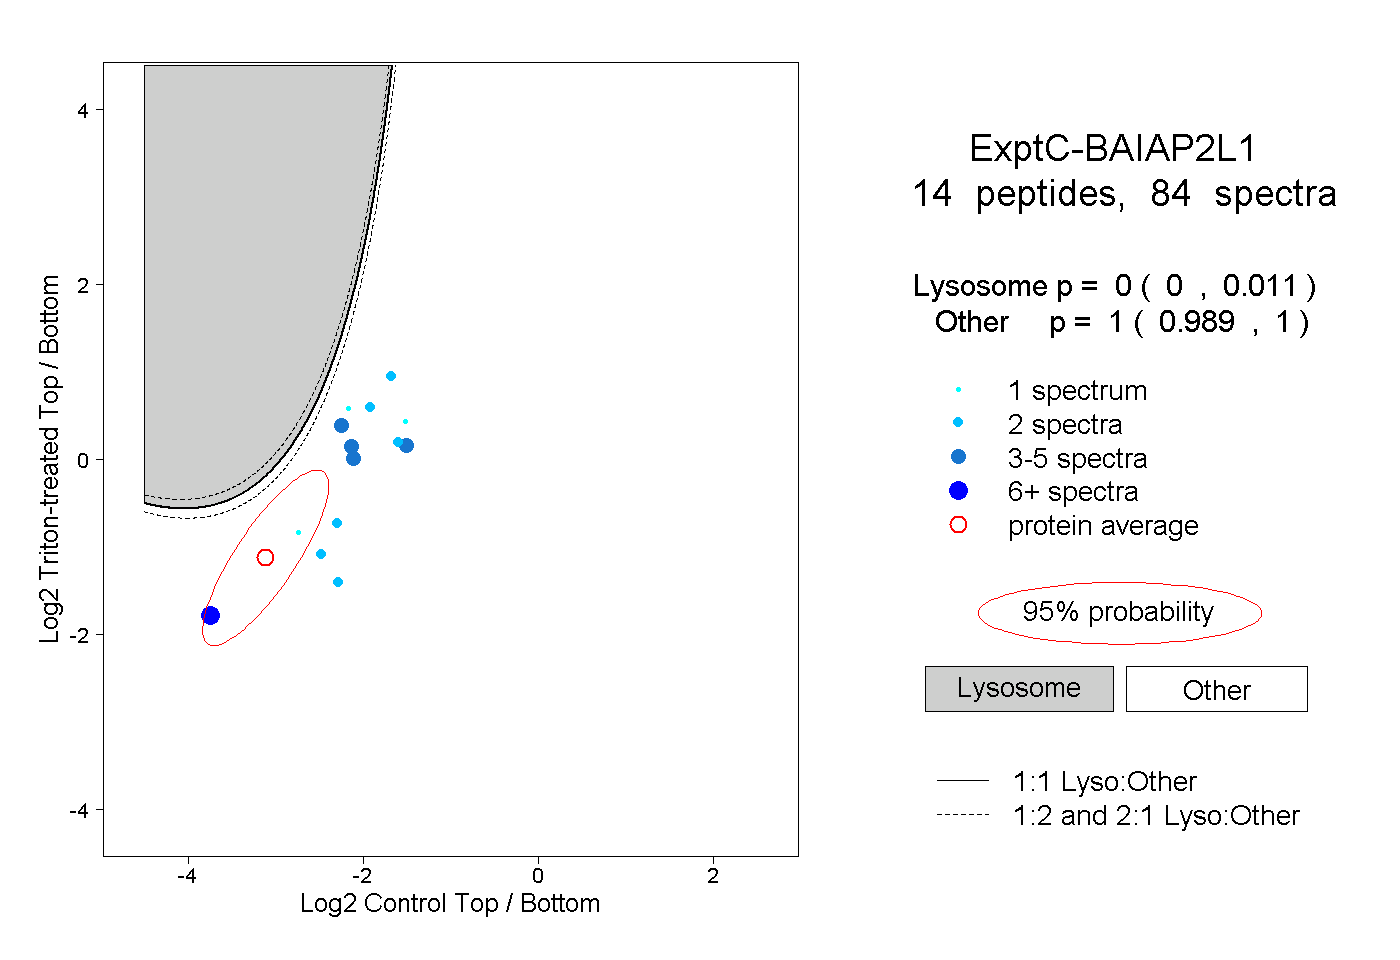
0.000 | 0.011
0.989 | 1.000
1peptide
spectrum
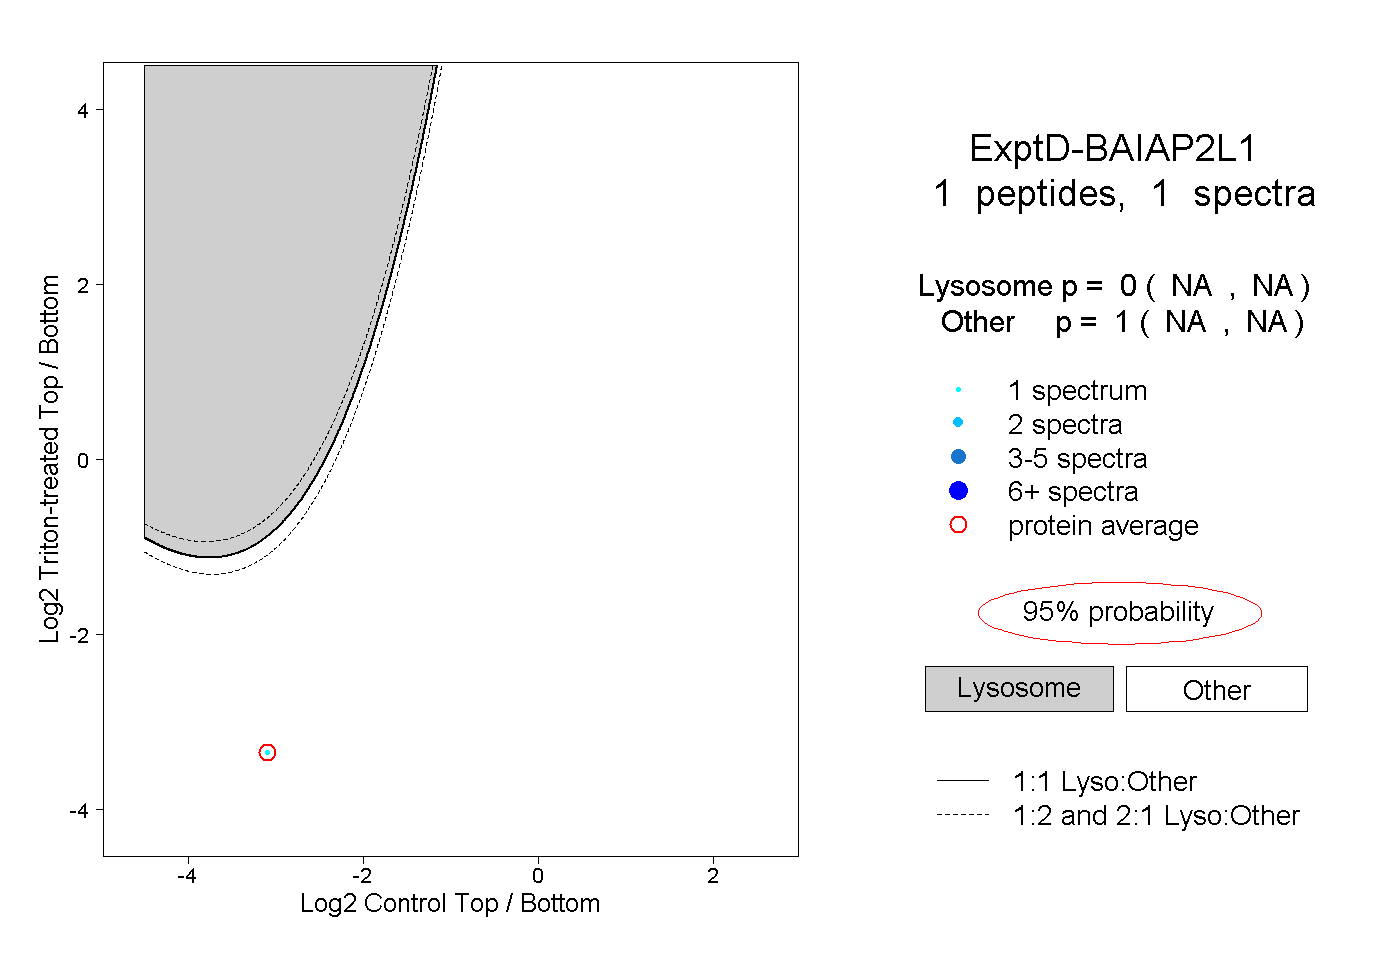
NA | NA
NA | NA