BAG6
[ENSRNOP00000057557]
Main page
| | | Plot |
Mito |
Lyso |
|
Perox |
ER |
Golgi |
PM |
Cytosol |
Nucleus |
|
| Expt A |
 17
17
peptides |
26
spectra |
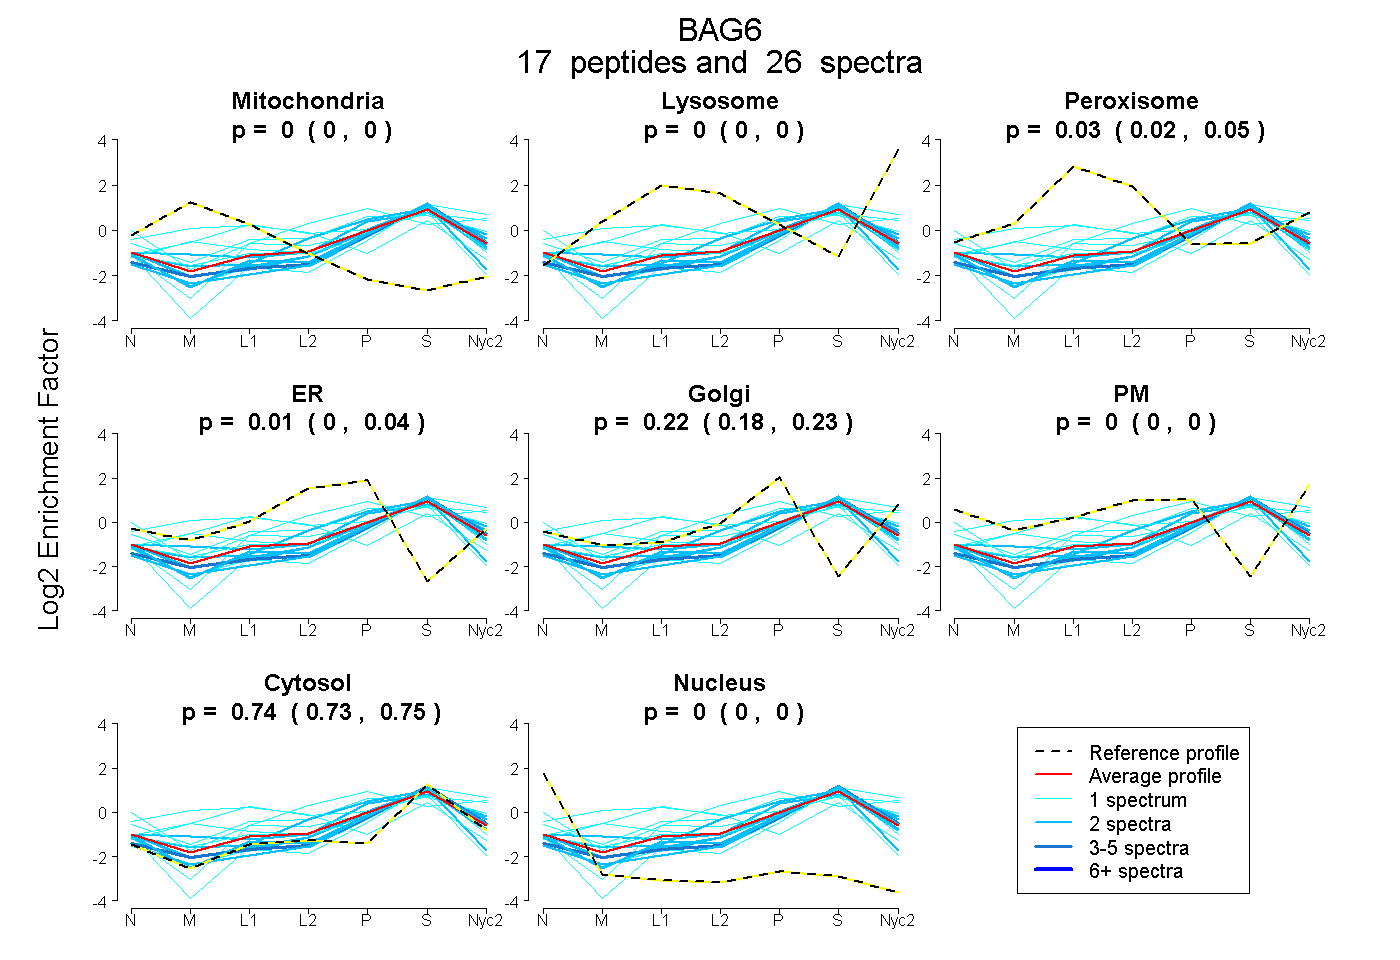 |
0.000
0.000 | 0.000 |
0.000
0.000 | 0.000 |
|
0.035
0.018 | 0.045 |
0.010
0.000 | 0.043 |
0.220
0.183 | 0.234 |
0.000
0.000 | 0.000 |
0.736
0.726 | 0.747 |
0.000
0.000 | 0.000 |
|
| | | Plot |
Mito |
|
Lyso or Perox |
|
ER |
Golgi |
PM |
Cytosol |
Nucleus |
|
| Expt B |
4
peptides |
6
spectra |
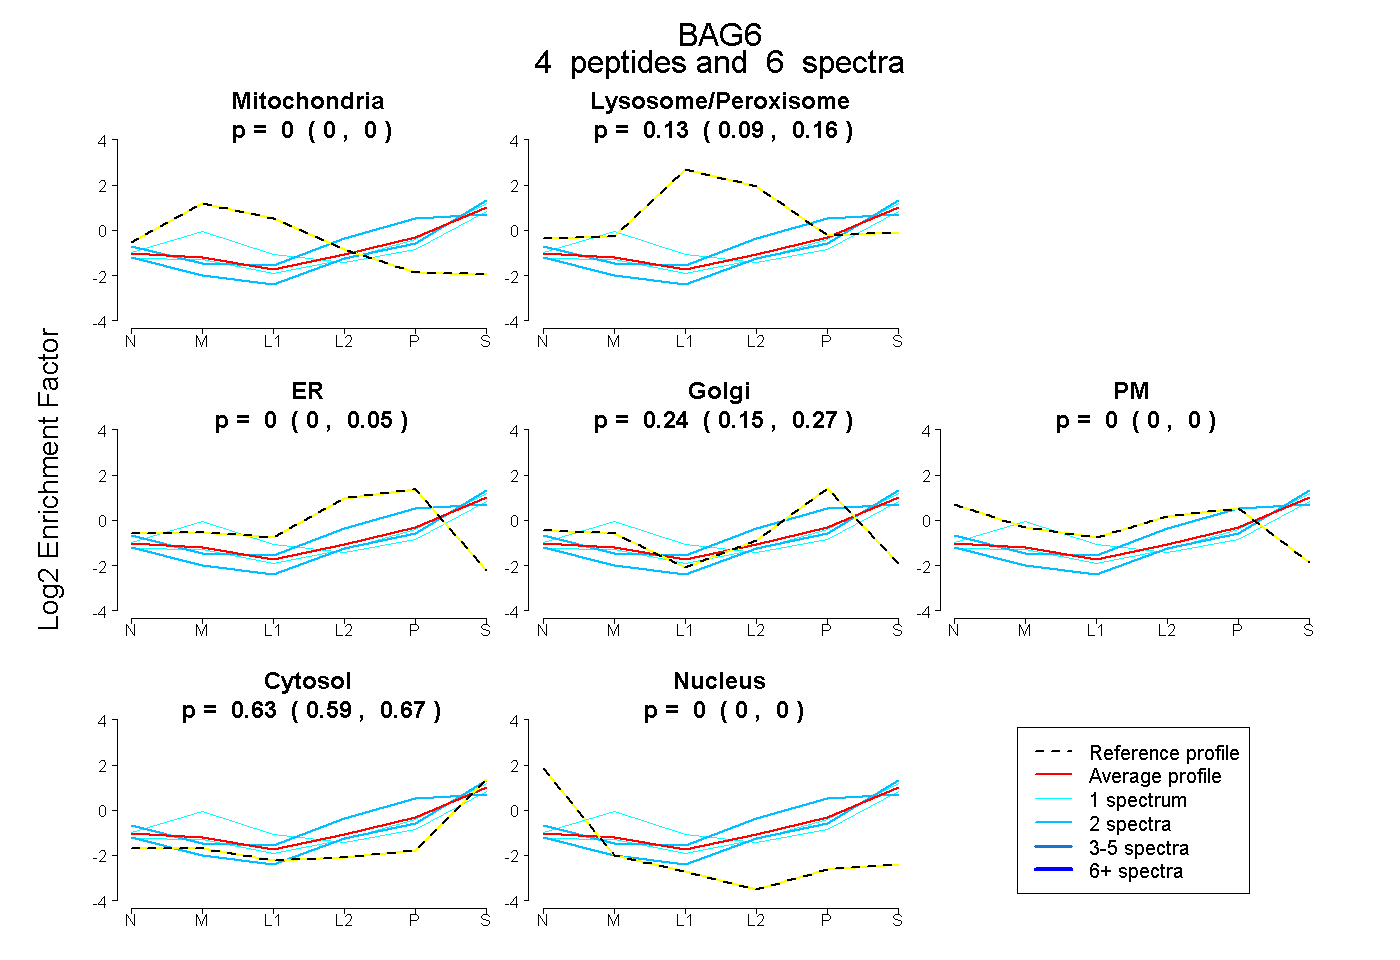 |
0.000
0.000 | 0.000 |
|
0.133
0.091 | 0.160 |
|
0.000
0.000 | 0.050 |
0.237
0.148 | 0.274 |
0.000
0.000 | 0.000 |
0.631
0.590 | 0.667 |
0.000
0.000 | 0.000 |
|
| 2 spectra, LINLVGESLR |
0.000 |
|
0.000 |
|
0.118 |
0.077 |
0.000 |
0.805 |
0.000 |
|
| 1 spectrum, DLEAPEVQESYR |
0.190 |
|
0.130 |
|
0.000 |
0.105 |
0.000 |
0.576 |
0.000 |
|
| 1 spectrum, DIQTLLSR |
0.000 |
|
0.093 |
|
0.000 |
0.208 |
0.000 |
0.699 |
0.000 |
|
| 2 spectra, LIYQGR |
0.000 |
|
0.140 |
|
0.162 |
0.238 |
0.000 |
0.461 |
0.000 |
|
| | | Plot |
|
Lyso |
|
|
|
|
|
|
|
Other |
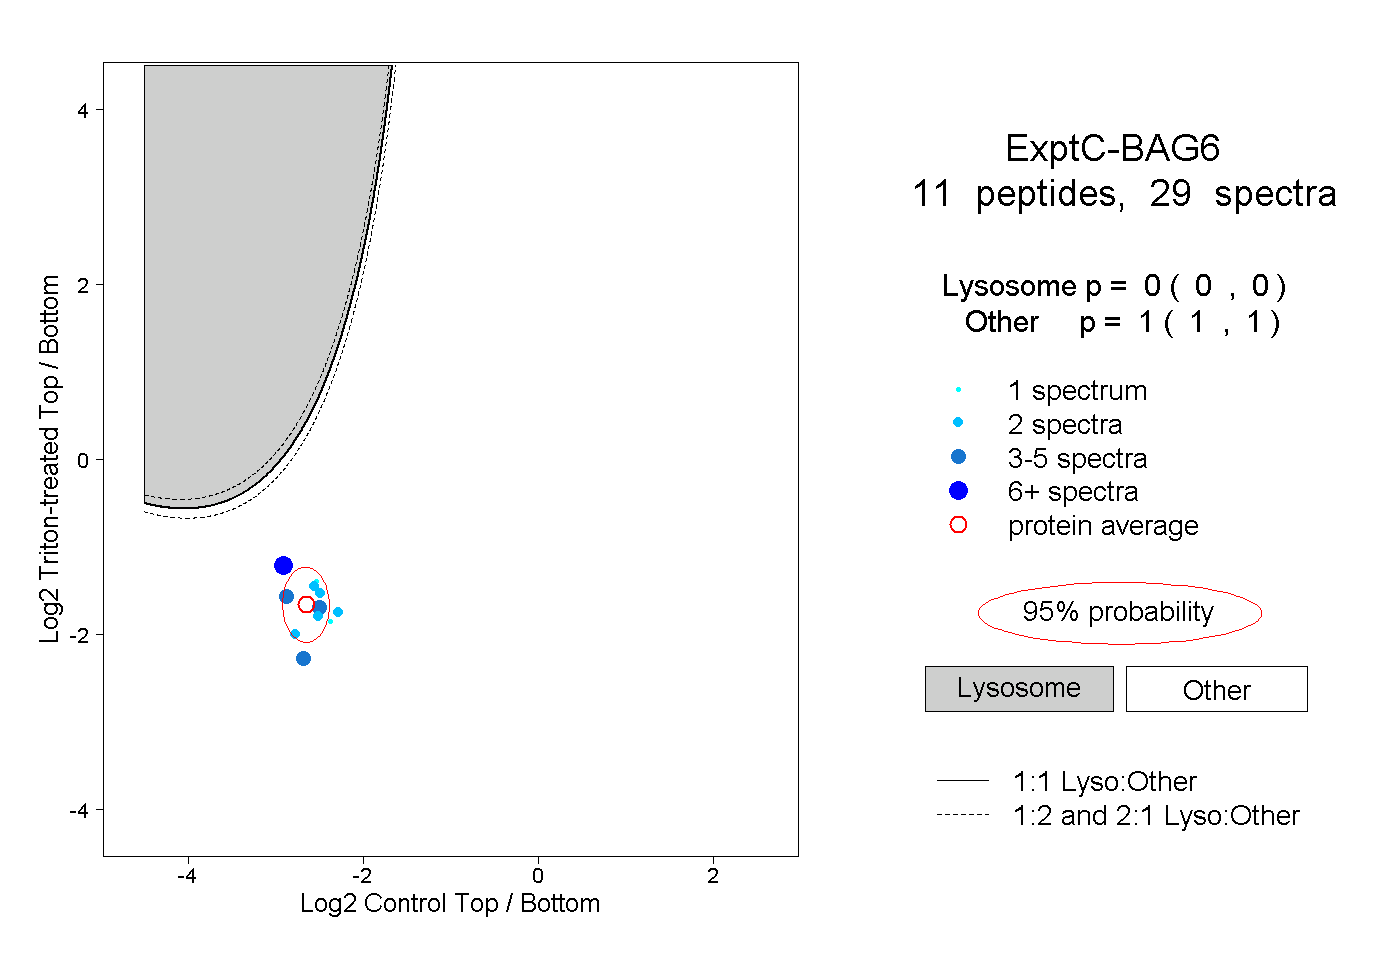
| Expt C |
11
peptides |
29
spectra |
 |
|
0.000
0.000 | 0.000 |
|
|
|
|
|
|
|
1.000
1.000 | 1.000 |