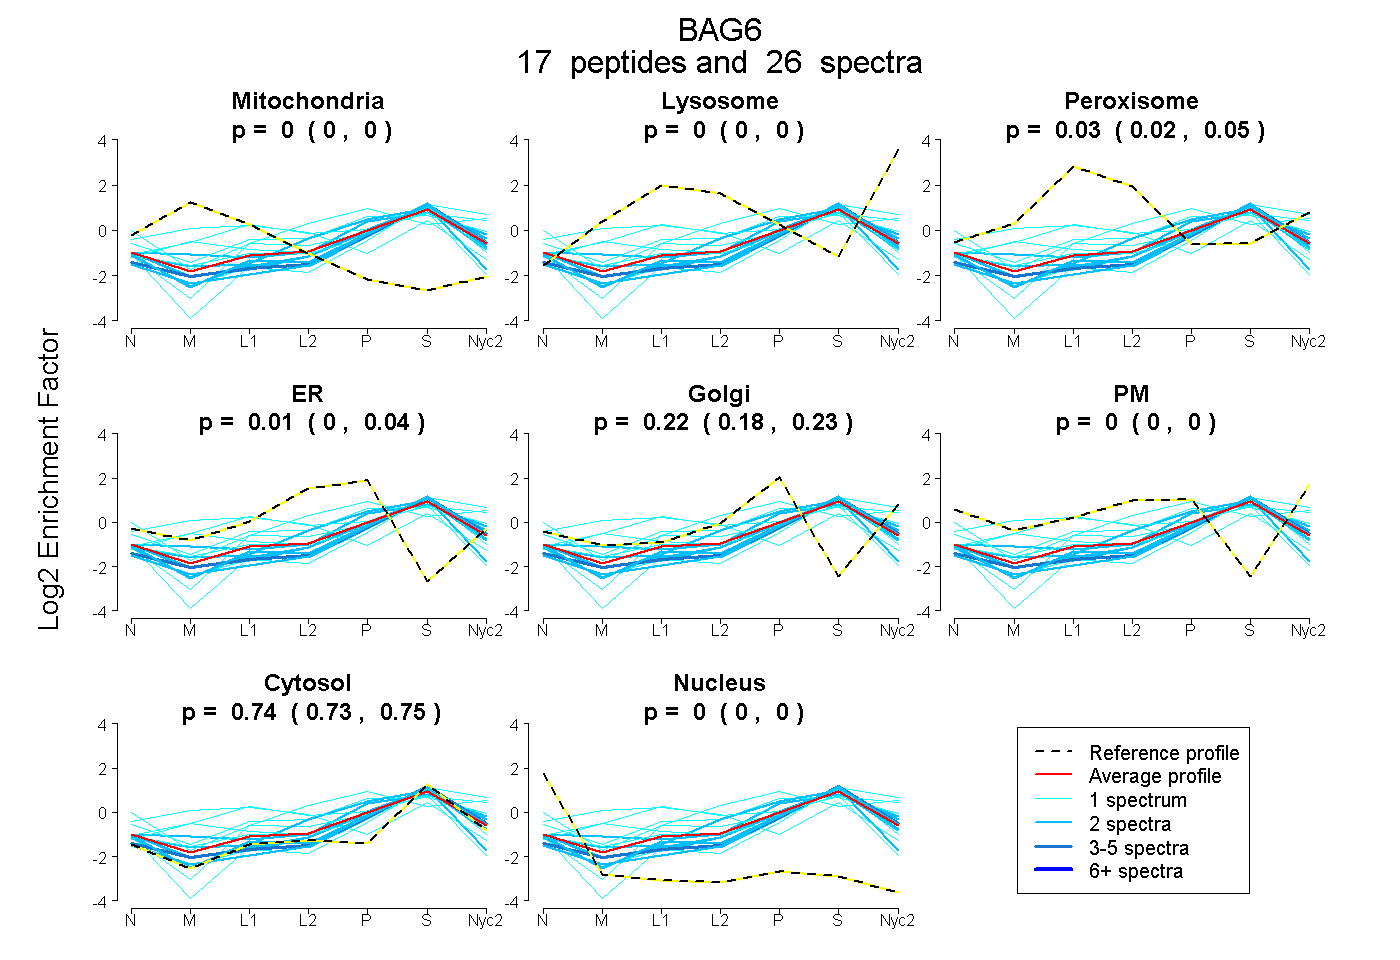
 17
17peptides
spectra
0.000 | 0.000
0.000 | 0.000
0.018 | 0.045
0.000 | 0.043
0.183 | 0.234
0.000 | 0.000
0.726 | 0.747
0.000 | 0.000
| Plot | Mito | Lyso | Perox | ER | Golgi | PM | Cytosol | Nucleus | |||||
| Expt A |
17 peptides |
26 spectra |
|
0.000 0.000 | 0.000 |
0.000 0.000 | 0.000 |
0.035 0.018 | 0.045 |
0.010 0.000 | 0.043 |
0.220 0.183 | 0.234 |
0.000 0.000 | 0.000 |
0.736 0.726 | 0.747 |
0.000 0.000 | 0.000 |
| 2 spectra, LLGNTFVALSDLR | 0.000 | 0.000 | 0.000 | 0.000 | 0.211 | 0.000 | 0.789 | 0.000 | ||
| 1 spectrum, GPGASGHDR | 0.000 | 0.015 | 0.000 | 0.100 | 0.063 | 0.368 | 0.453 | 0.000 | ||
| 2 spectra, LINLVGESLR | 0.000 | 0.000 | 0.000 | 0.000 | 0.229 | 0.000 | 0.771 | 0.000 | ||
| 3 spectra, LQVVLEHMPVGPDAILR | 0.000 | 0.000 | 0.000 | 0.000 | 0.159 | 0.000 | 0.841 | 0.000 | ||
| 2 spectra, LQEDPNYSPQR | 0.000 | 0.000 | 0.000 | 0.195 | 0.067 | 0.000 | 0.738 | 0.000 | ||
| 1 spectrum, DIQTLLSR | 0.000 | 0.000 | 0.000 | 0.000 | 0.073 | 0.000 | 0.906 | 0.021 | ||
| 2 spectra, TLDSQTR | 0.000 | 0.000 | 0.000 | 0.000 | 0.168 | 0.000 | 0.832 | 0.000 | ||
| 1 spectrum, TFIVGAQMNVK | 0.209 | 0.000 | 0.000 | 0.160 | 0.000 | 0.000 | 0.631 | 0.000 | ||
| 1 spectrum, MATHTLITGLEEYVR | 0.000 | 0.182 | 0.245 | 0.000 | 0.094 | 0.000 | 0.478 | 0.000 | ||
| 1 spectrum, DLEAPEVQESYR | 0.291 | 0.000 | 0.302 | 0.000 | 0.000 | 0.000 | 0.408 | 0.000 | ||
| 2 spectra, CNLACAPPR | 0.065 | 0.000 | 0.000 | 0.026 | 0.065 | 0.000 | 0.808 | 0.035 | ||
| 2 spectra, AAGARPLTSPESLSR | 0.000 | 0.051 | 0.001 | 0.000 | 0.316 | 0.000 | 0.632 | 0.000 | ||
| 1 spectrum, LIYQGR | 0.000 | 0.000 | 0.179 | 0.000 | 0.316 | 0.000 | 0.505 | 0.000 | ||
| 1 spectrum, AGSSESIAAFIQR | 0.000 | 0.000 | 0.000 | 0.000 | 0.088 | 0.000 | 0.893 | 0.019 | ||
| 1 spectrum, LQDYNVGGK | 0.000 | 0.171 | 0.000 | 0.000 | 0.086 | 0.000 | 0.744 | 0.000 | ||
| 2 spectra, LVMAQHMIR | 0.000 | 0.000 | 0.000 | 0.000 | 0.122 | 0.000 | 0.878 | 0.000 | ||
| 1 spectrum, LQPQLR | 0.013 | 0.000 | 0.067 | 0.026 | 0.122 | 0.000 | 0.772 | 0.000 |
| Plot | Mito | Lyso or Perox | ER | Golgi | PM | Cytosol | Nucleus | ||||||
| Expt B |
4 peptides |
6 spectra |
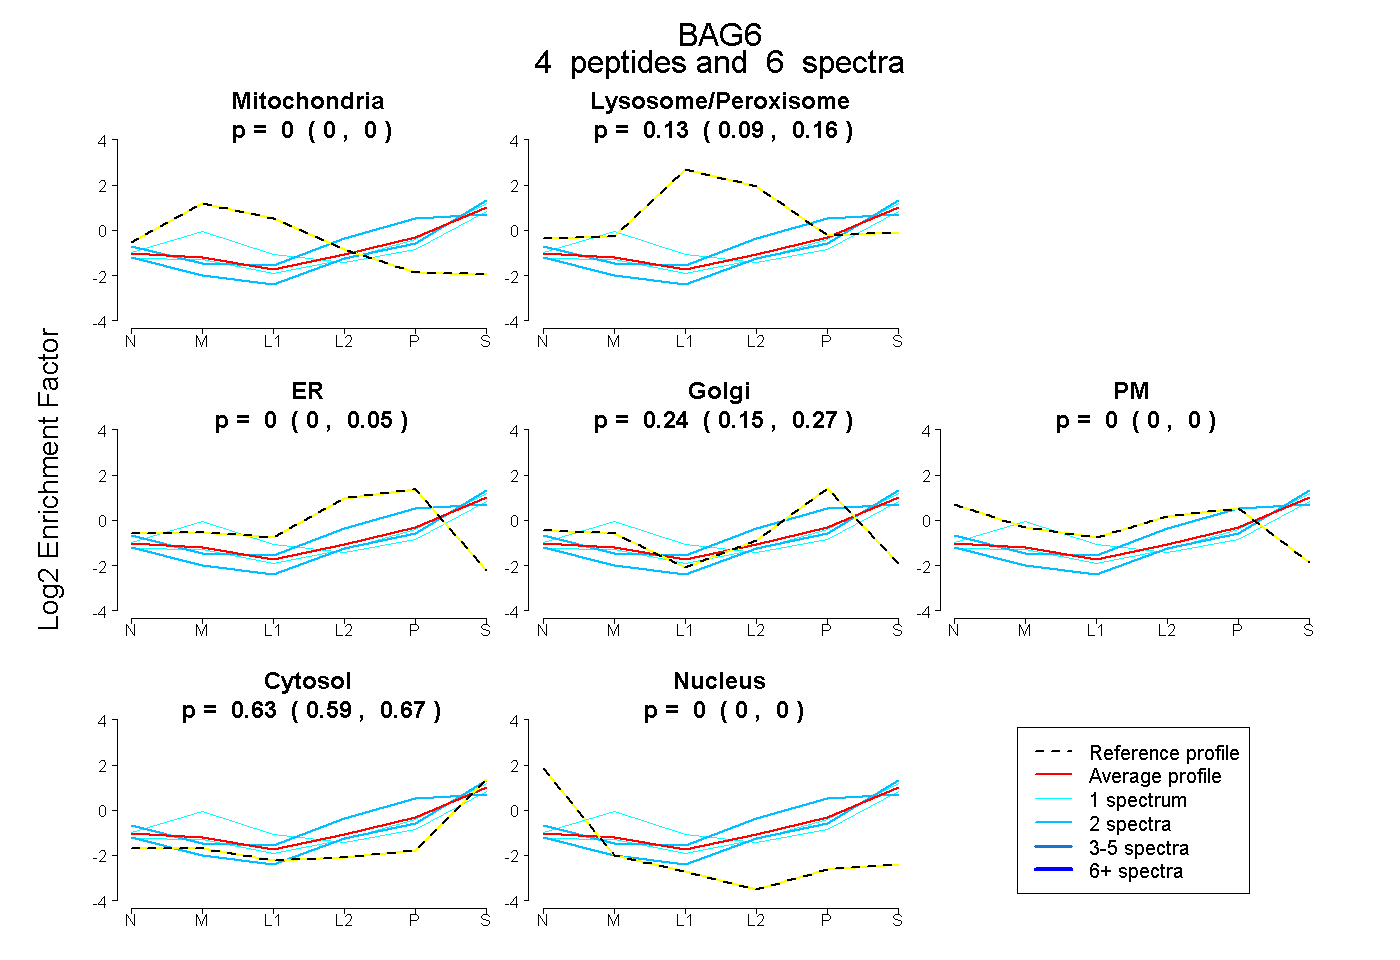 |
0.000 0.000 | 0.000 |
0.133 0.091 | 0.160 |
0.000 0.000 | 0.050 |
0.237 0.148 | 0.274 |
0.000 0.000 | 0.000 |
0.631 0.590 | 0.667 |
0.000 0.000 | 0.000 |
|||
| Plot | Lyso | Other | |||||||||||
| Expt C |
11 peptides |
29 spectra |
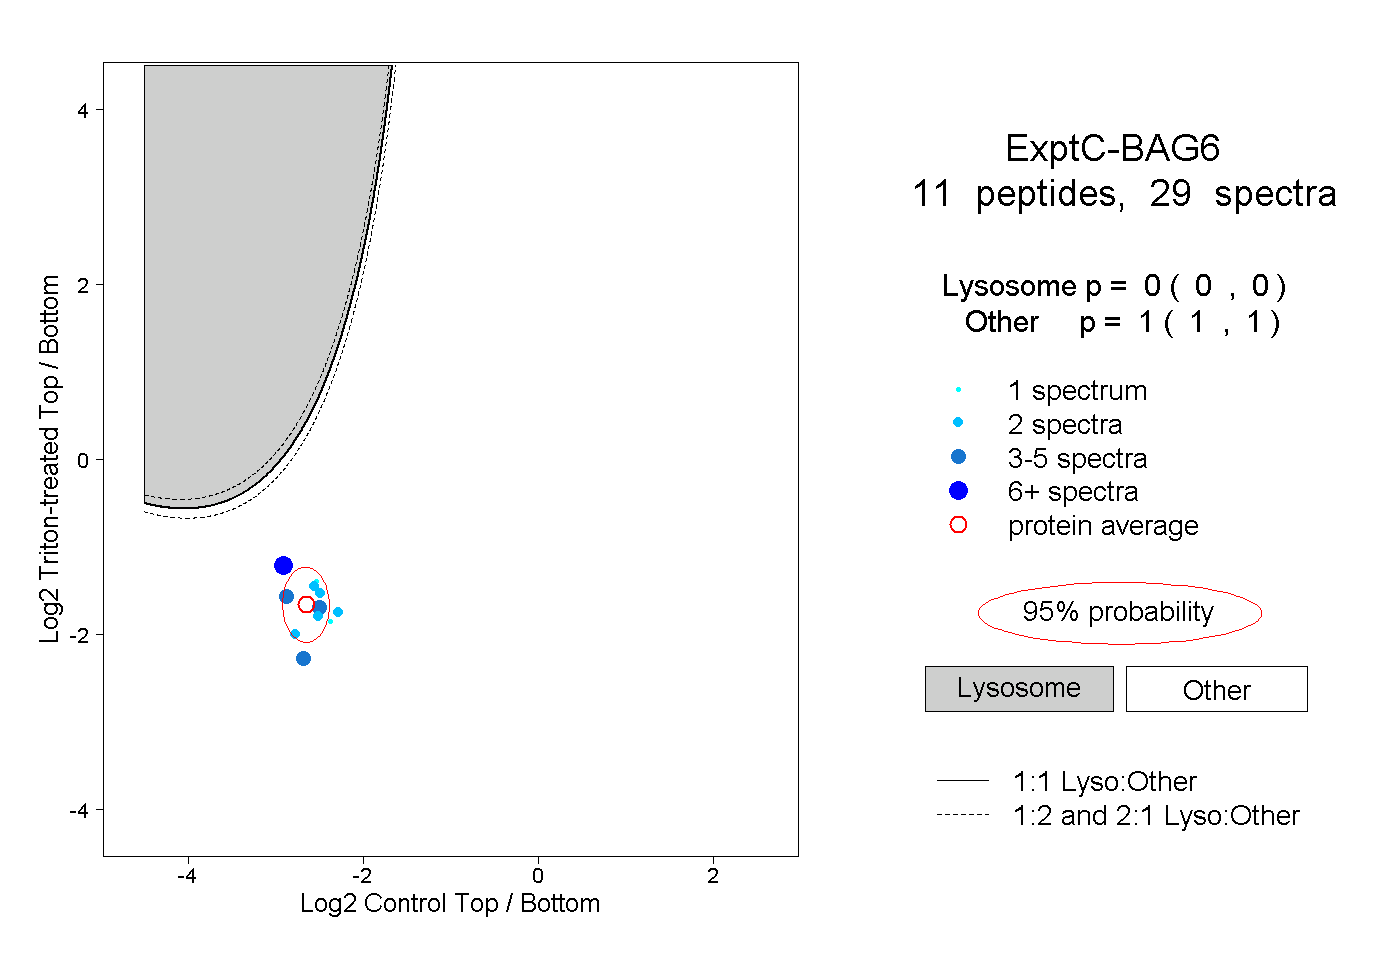 |
0.000 0.000 | 0.000 |
1.000 1.000 | 1.000 |