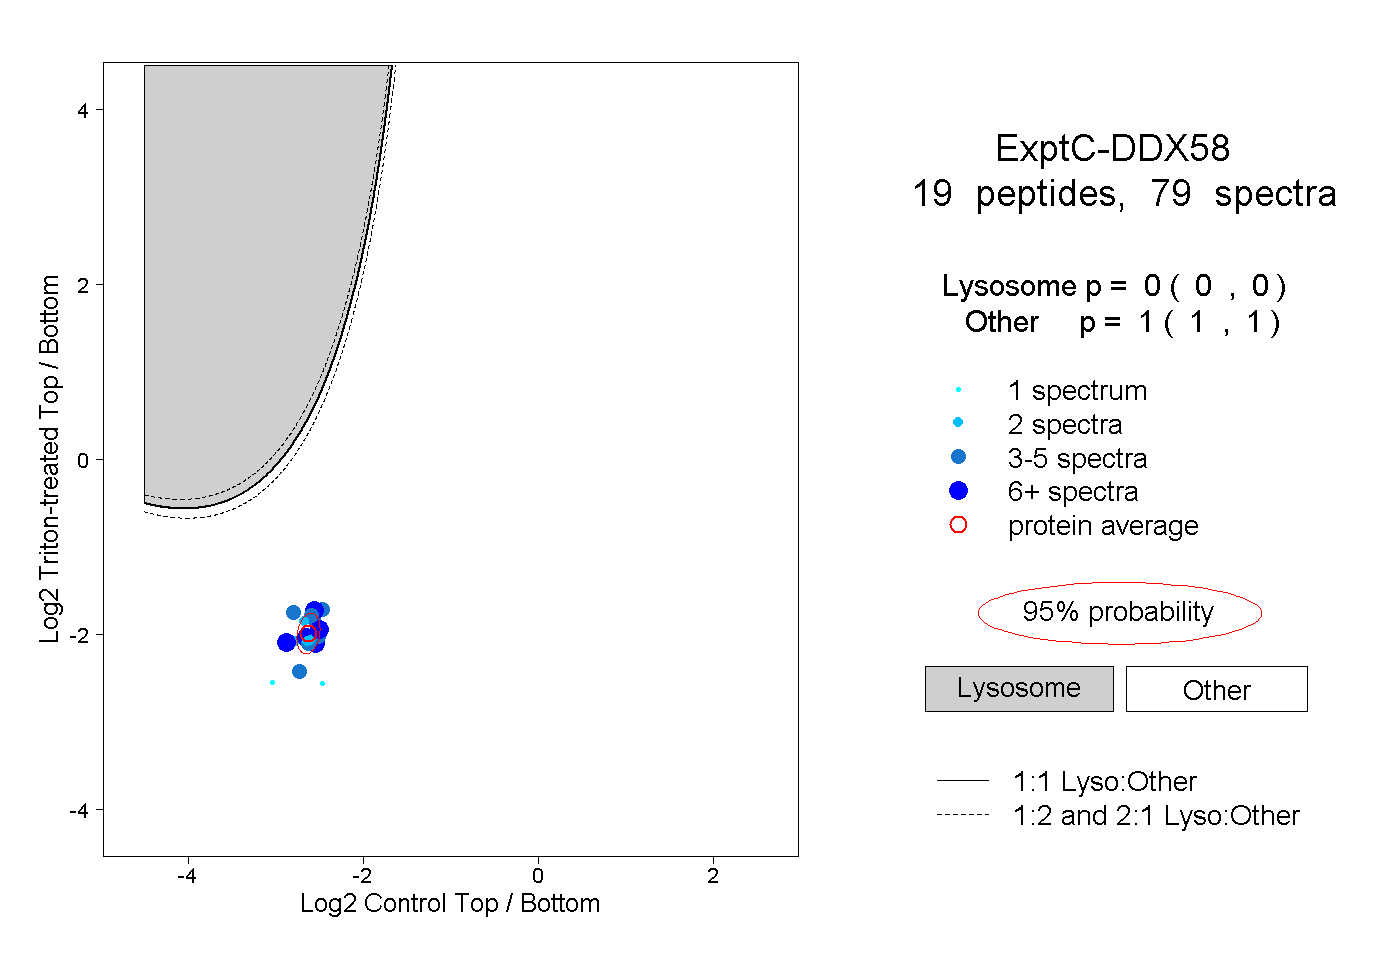
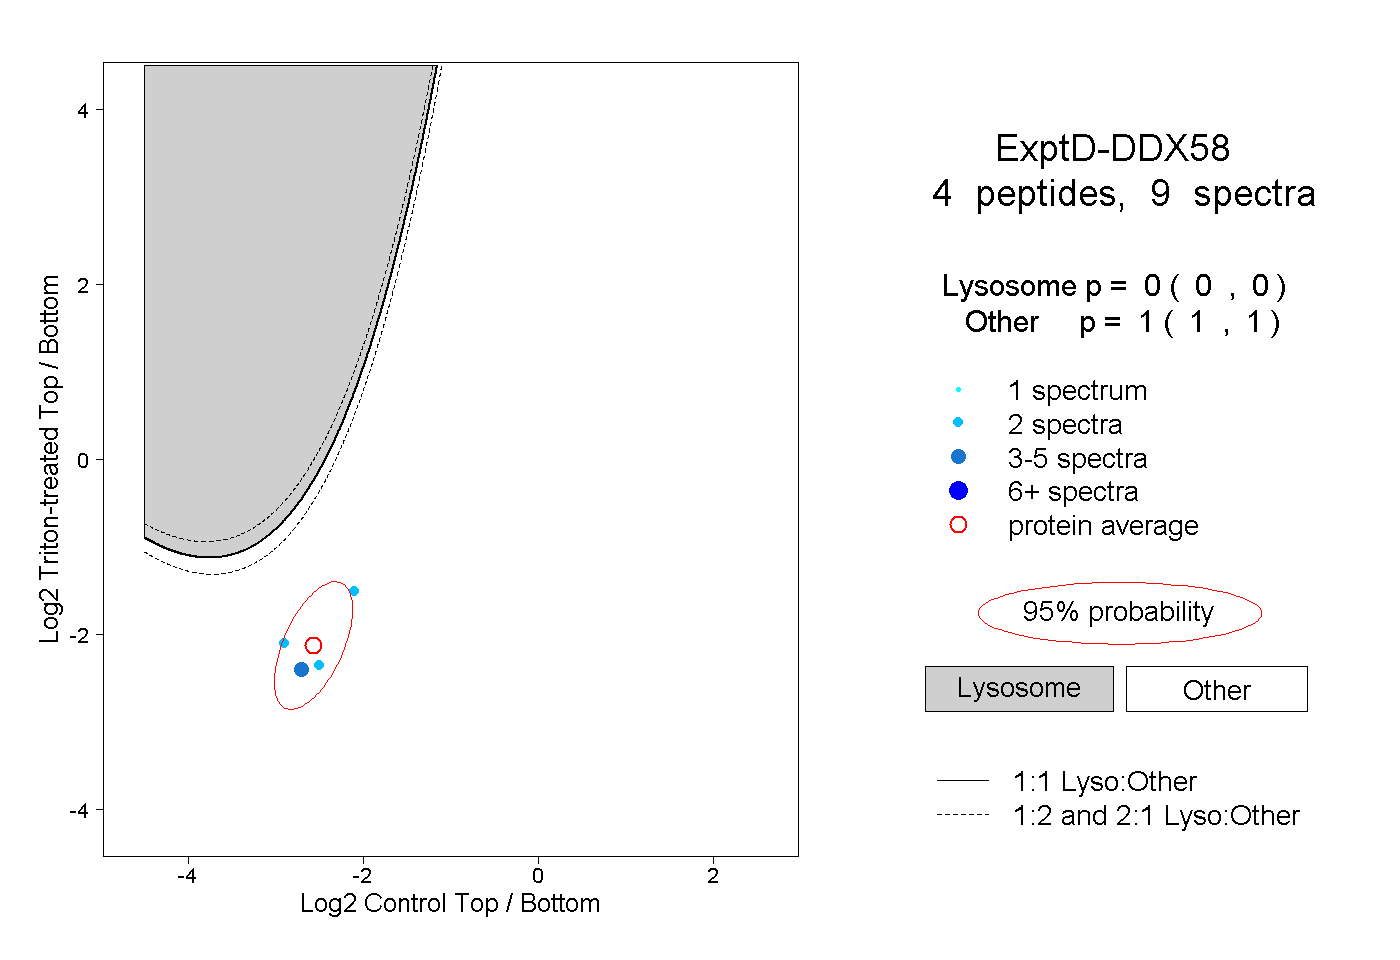
19
19peptides
spectra
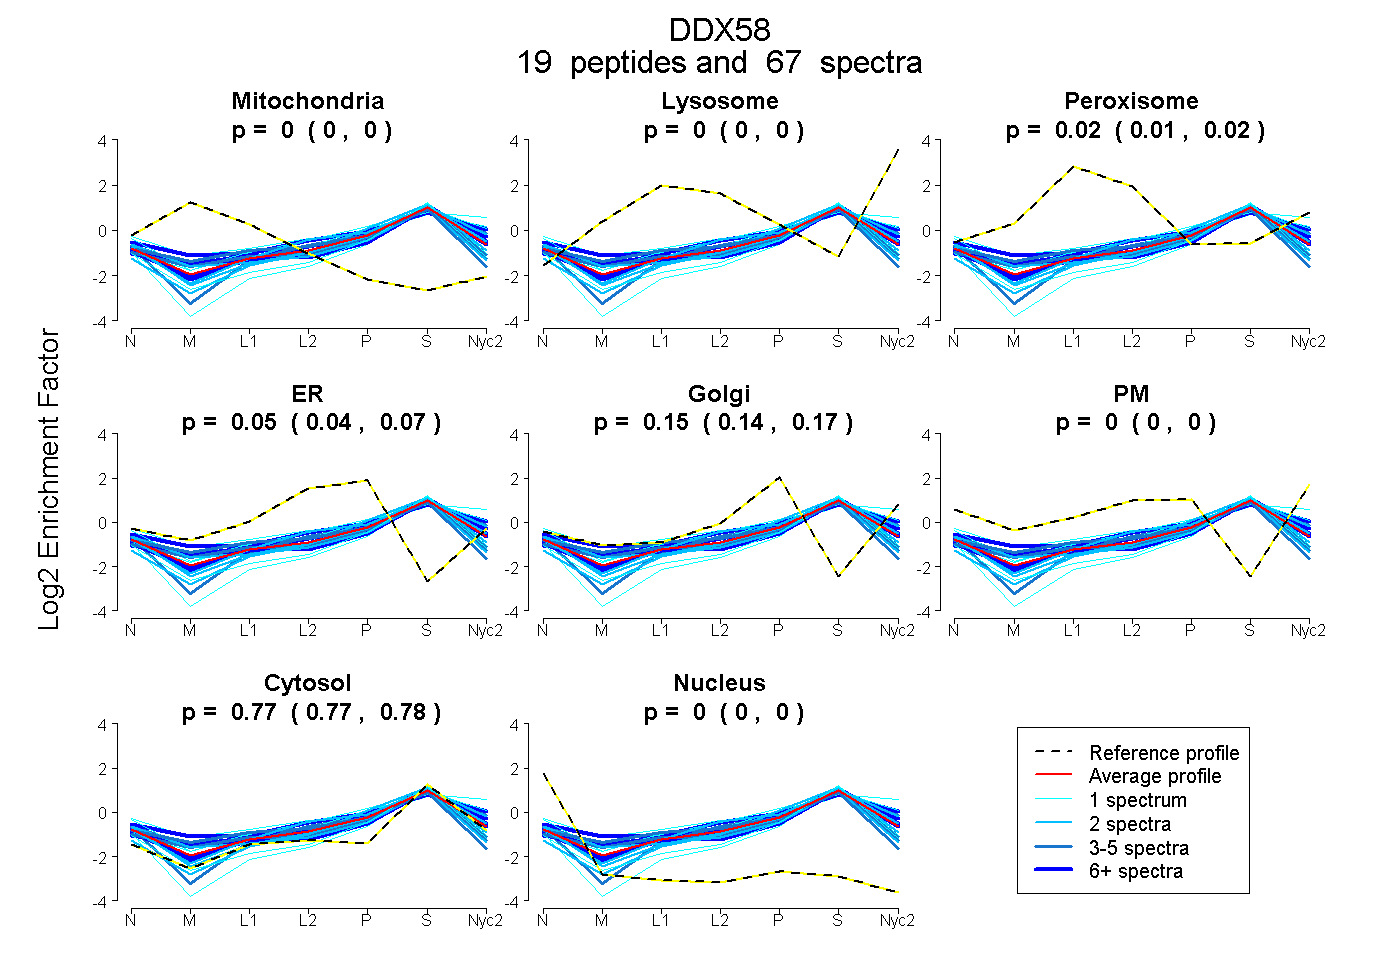
0.000 | 0.000
0.000 | 0.000
0.012 | 0.023
0.036 | 0.068
0.138 | 0.167
0.000 | 0.000
0.769 | 0.778
0.000 | 0.000
13peptides
spectra
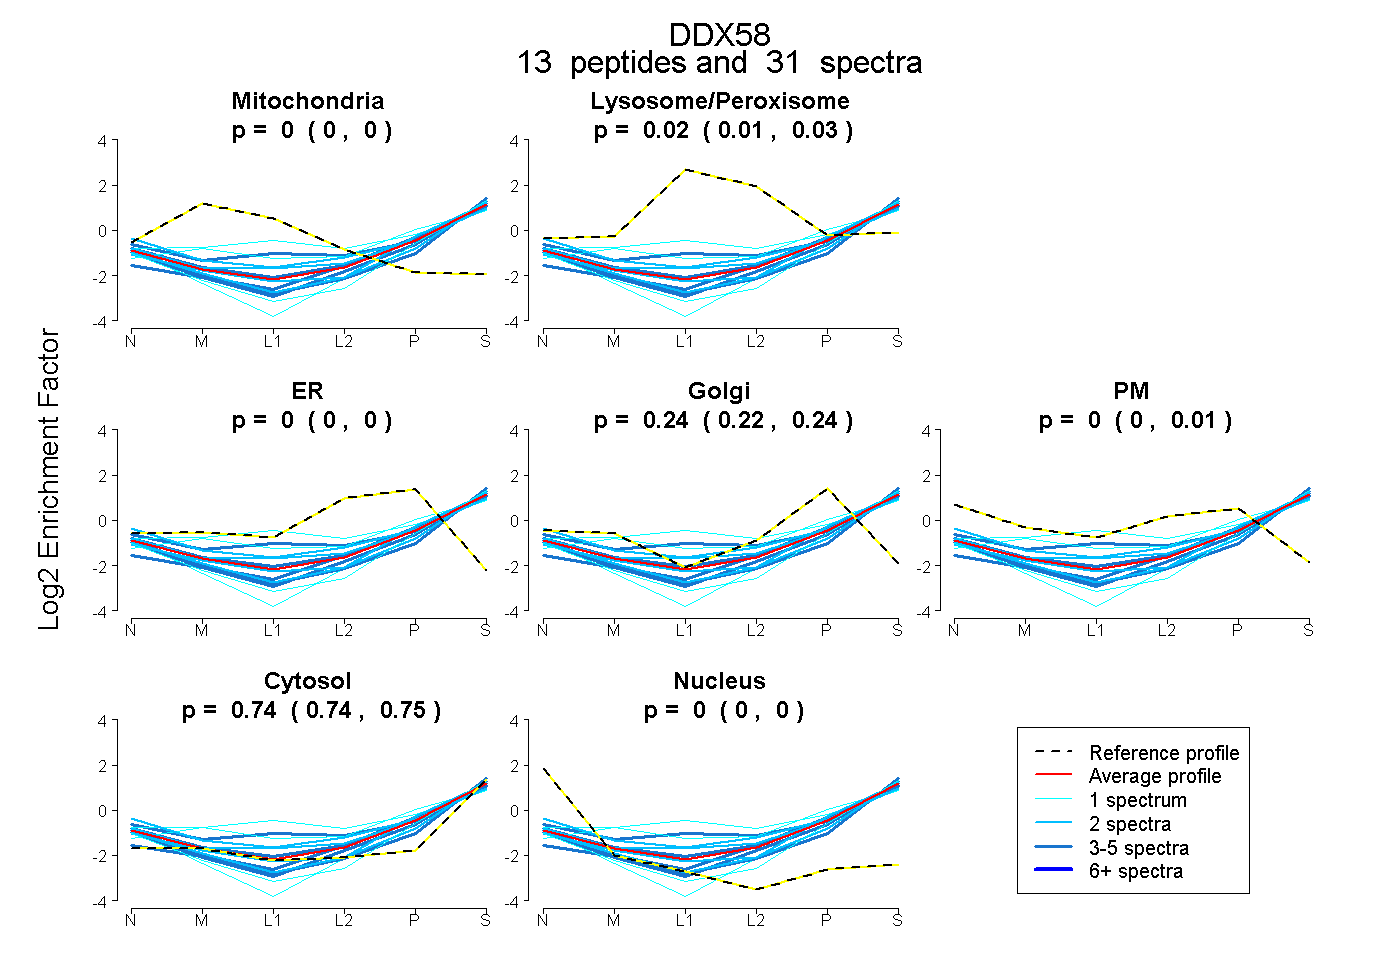
0.000 | 0.000
0.005 | 0.028
0.000 | 0.000
0.223 | 0.244
0.000 | 0.014
0.738 | 0.750
0.000 | 0.000