RBMXRTL
[ENSRNOP00000057432]
Main page
| | | Plot |
Mito |
Lyso |
|
Perox |
ER |
Golgi |
PM |
Cytosol |
Nucleus |
|
| Expt A |
 2
2
peptides |
3
spectra |
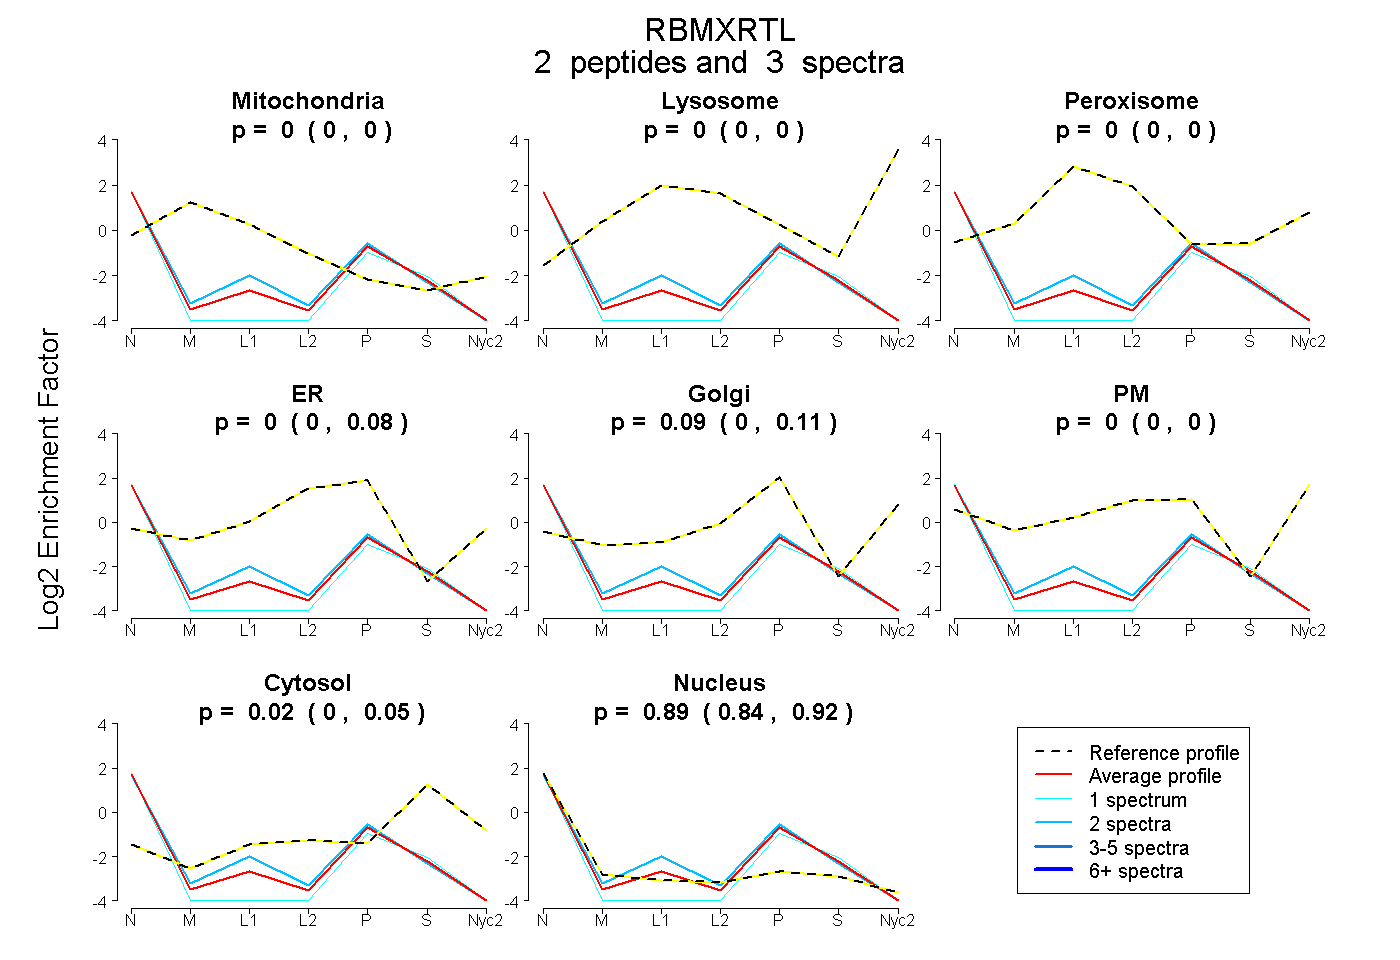 |
0.000
0.000 | 0.000 |
0.000
0.000 | 0.000 |
|
0.000
0.000 | 0.000 |
0.000
0.000 | 0.080 |
0.090
0.000 | 0.114 |
0.000
0.000 | 0.000 |
0.020
0.000 | 0.053 |
0.890
0.843 | 0.923 |
|
| | | Plot |
Mito |
|
Lyso or Perox |
|
ER |
Golgi |
PM |
Cytosol |
Nucleus |
|
| Expt B |
4
peptides |
7
spectra |
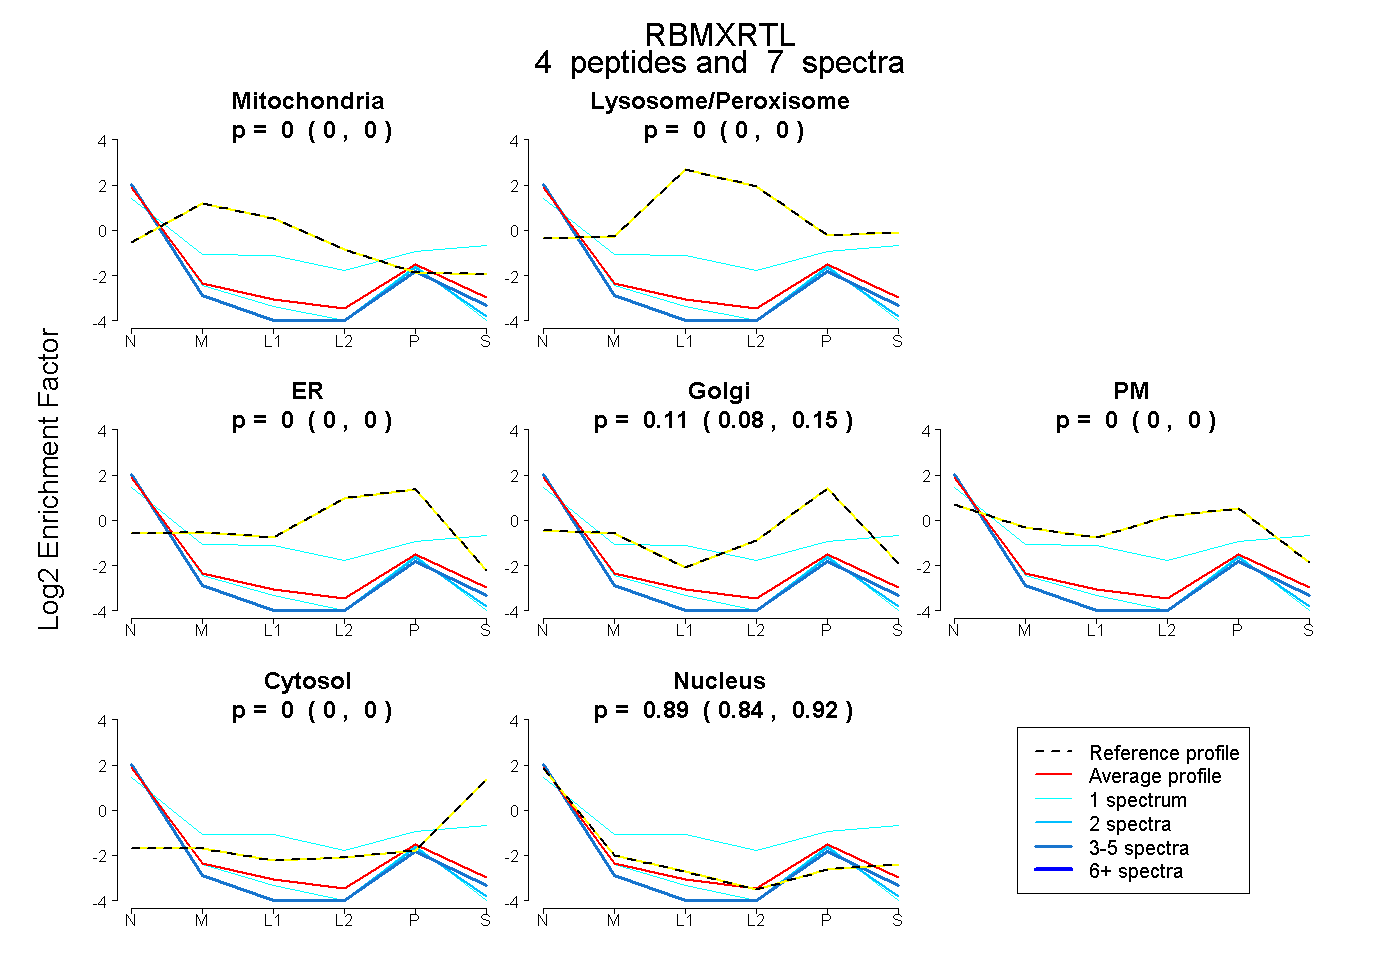 |
0.000
0.000 | 0.000 |
|
0.000
0.000 | 0.000 |
|
0.000
0.000 | 0.000 |
0.114
0.078 | 0.146 |
0.000
0.000 | 0.000 |
0.000
0.000 | 0.000 |
0.886
0.845 | 0.916 |
|
| 1 spectrum, GYPPPR |
0.000 |
|
0.181 |
|
0.000 |
0.000 |
0.239 |
0.130 |
0.451 |
|
| 2 spectra, GPPPSYGGSSR |
0.000 |
|
0.000 |
|
0.000 |
0.000 |
0.000 |
0.000 |
1.000 |
|
| 1 spectrum, DVYLSPR |
0.000 |
|
0.000 |
|
0.000 |
0.025 |
0.000 |
0.000 |
0.975 |
|
| 3 spectra, IVEILLMK |
0.000 |
|
0.000 |
|
0.000 |
0.000 |
0.000 |
0.000 |
1.000 |
|