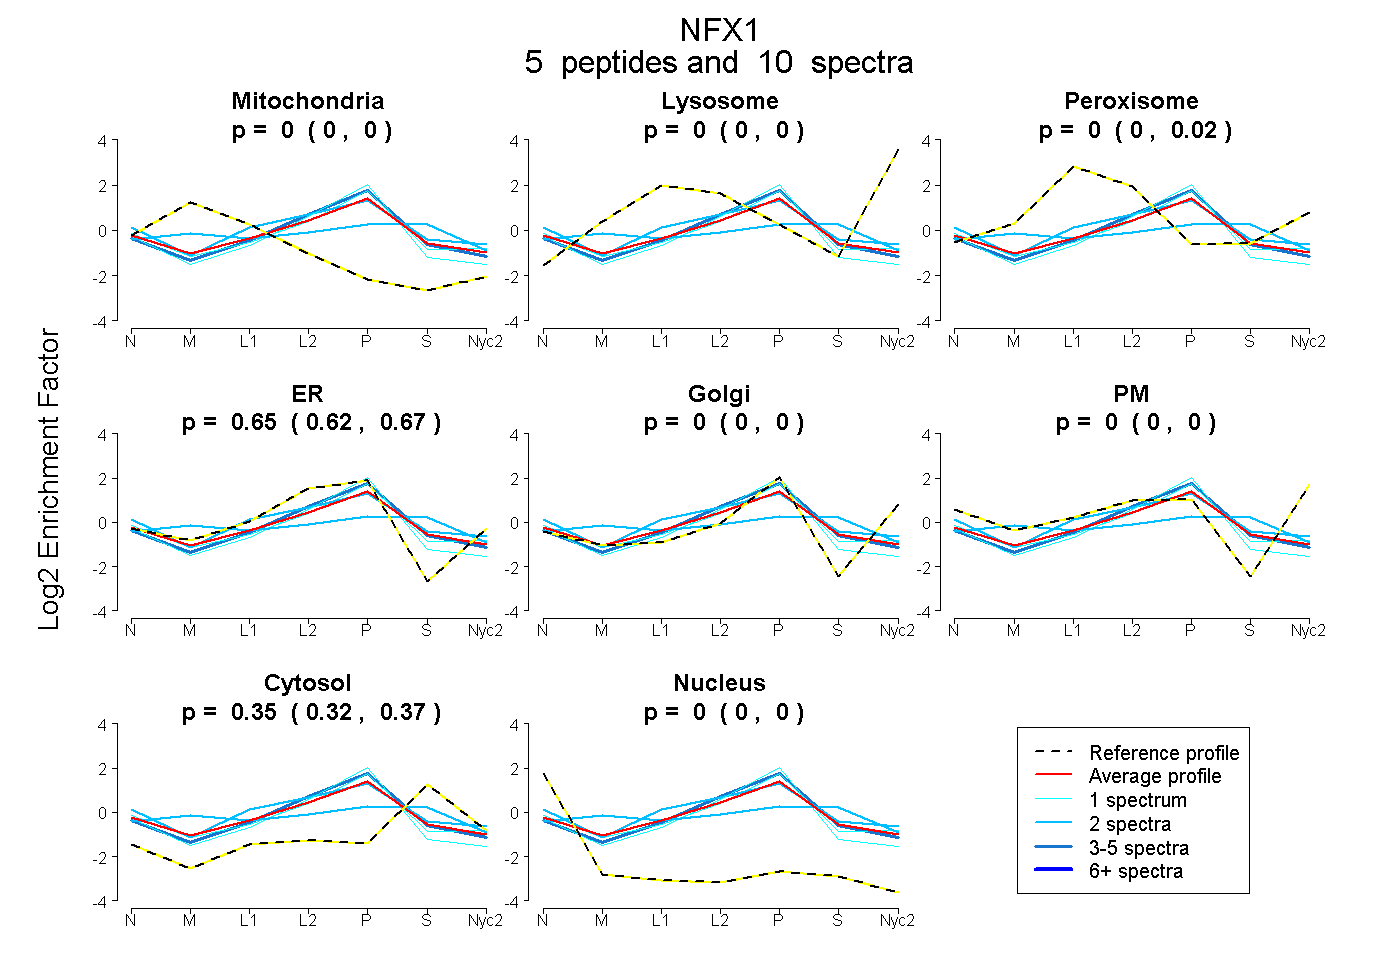
 5
5peptides
spectra
0.000 | 0.000
0.000 | 0.000
0.000 | 0.017
0.619 | 0.672
0.000 | 0.000
0.000 | 0.000
0.322 | 0.366
0.000 | 0.000
| Plot | Mito | Lyso | Perox | ER | Golgi | PM | Cytosol | Nucleus | |||||
| Expt A |
5 peptides |
10 spectra |
|
0.000 0.000 | 0.000 |
0.000 0.000 | 0.000 |
0.000 0.000 | 0.017 |
0.653 0.619 | 0.672 |
0.000 0.000 | 0.000 |
0.000 0.000 | 0.000 |
0.347 0.322 | 0.366 |
0.000 0.000 | 0.000 |
| 1 spectrum, QPCTTPR | 0.000 | 0.000 | 0.000 | 0.724 | 0.000 | 0.000 | 0.225 | 0.051 | ||
| 4 spectra, LPHLVR | 0.000 | 0.000 | 0.000 | 0.682 | 0.000 | 0.000 | 0.318 | 0.000 | ||
| 2 spectra, NEIPHSCGEVCR | 0.000 | 0.000 | 0.124 | 0.576 | 0.000 | 0.000 | 0.301 | 0.000 | ||
| 1 spectrum, LQCDEECAALER | 0.000 | 0.000 | 0.000 | 0.617 | 0.097 | 0.000 | 0.286 | 0.000 | ||
| 2 spectra, SDGFGDFSCLK | 0.139 | 0.000 | 0.163 | 0.226 | 0.054 | 0.000 | 0.418 | 0.000 |
| Plot | Lyso | Other | |||||||||||
| Expt D |
1 peptide |
1 spectrum |
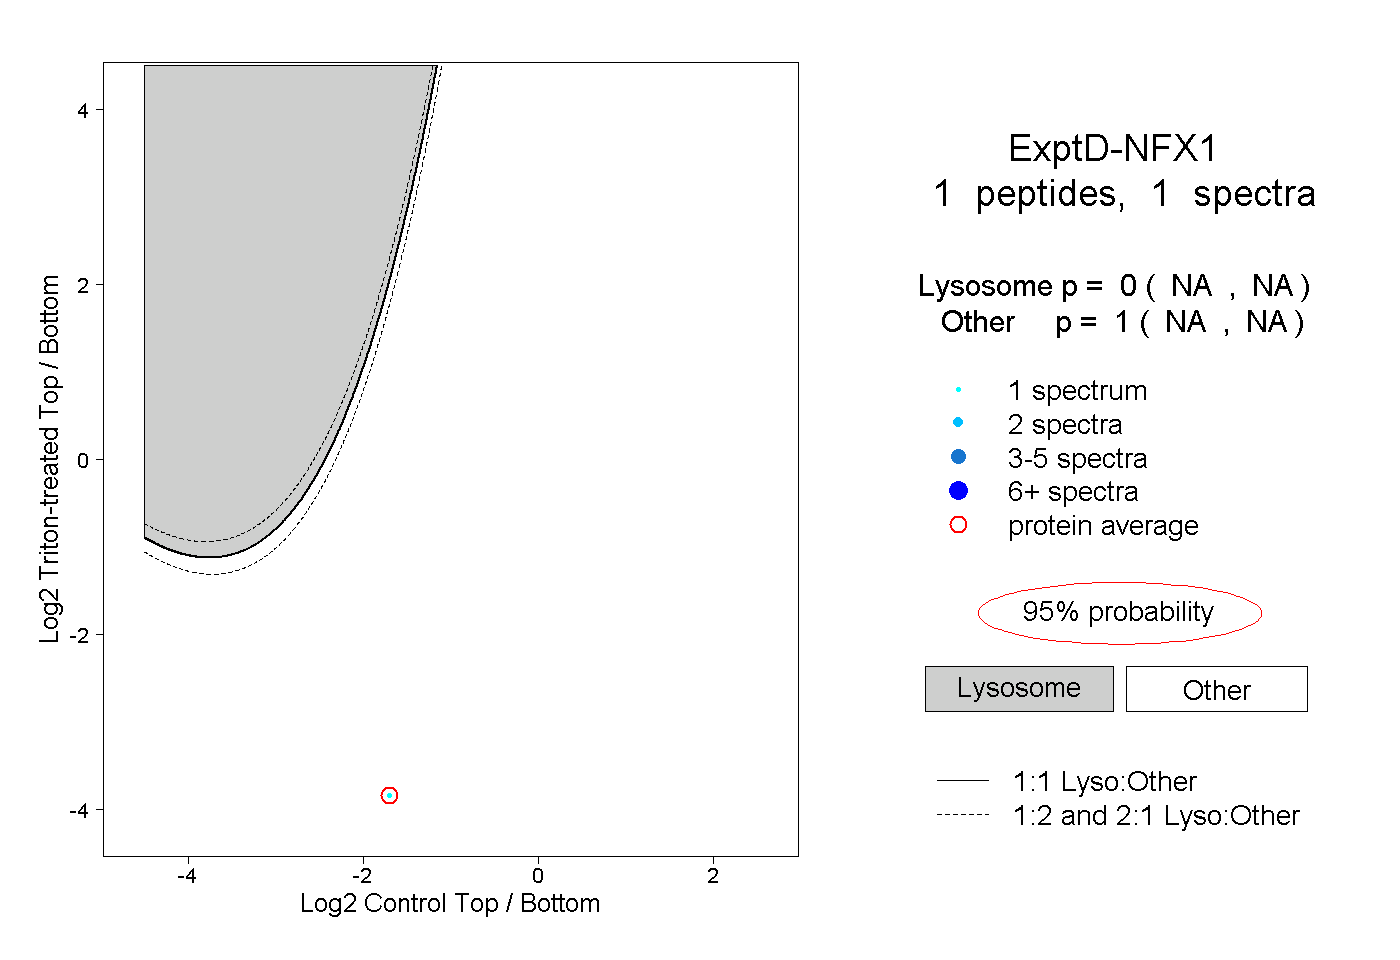 |
0.000 NA | NA |
1.000 NA | NA |