 4
4peptides
spectra
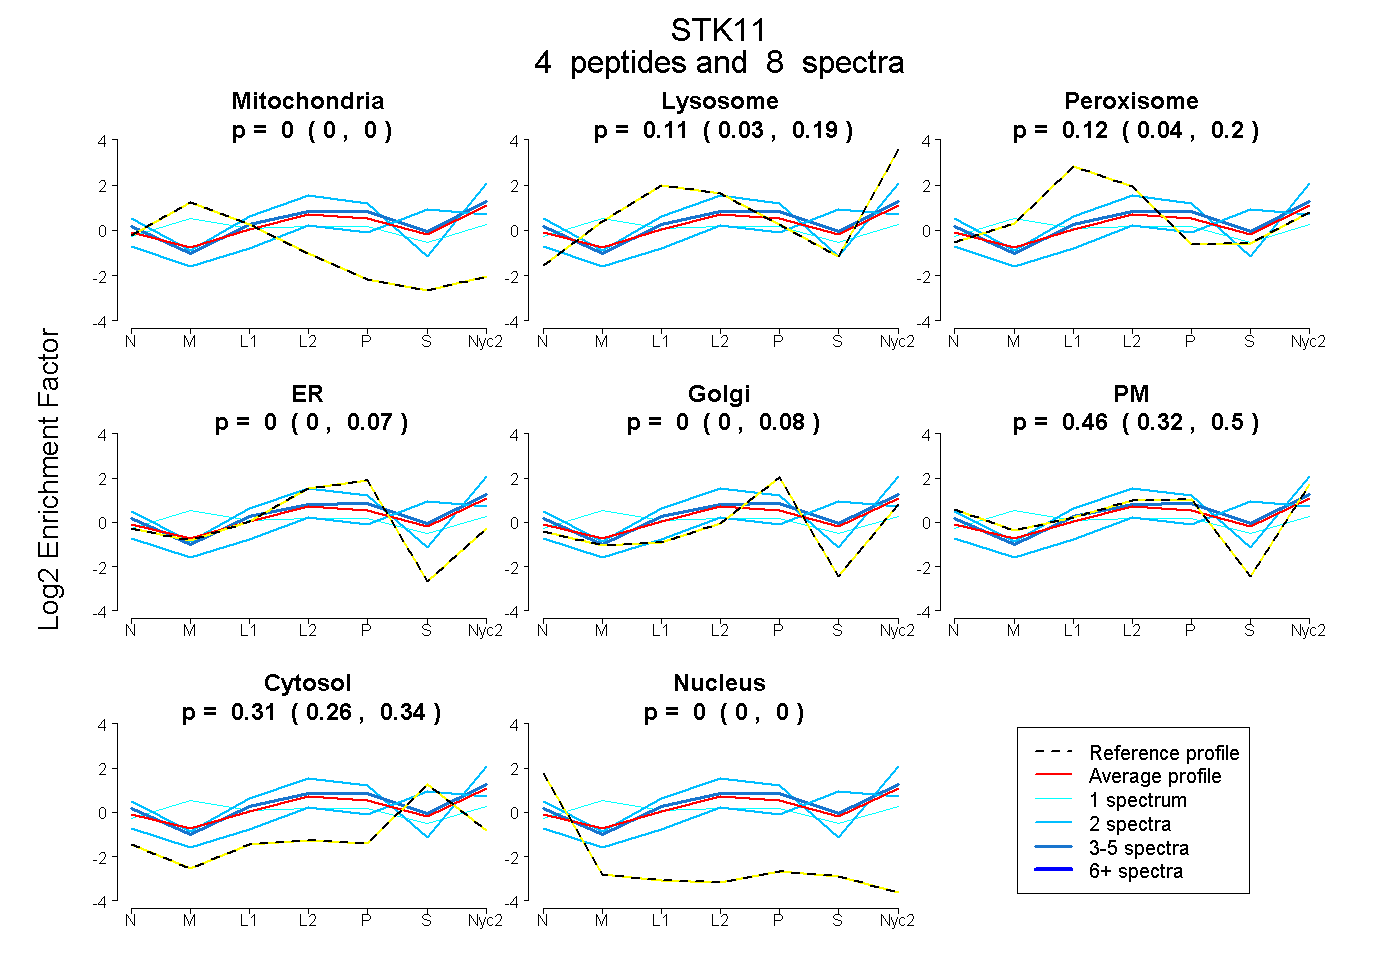
0.000 | 0.000
0.032 | 0.191
0.036 | 0.195
0.000 | 0.067
0.000 | 0.083
0.315 | 0.502
0.261 | 0.345
0.000 | 0.000
| Plot | Mito | Lyso | Perox | ER | Golgi | PM | Cytosol | Nucleus | |||||
| Expt A |
4 peptides |
8 spectra |
|
0.000 0.000 | 0.000 |
0.109 0.032 | 0.191 |
0.119 0.036 | 0.195 |
0.000 0.000 | 0.067 |
0.000 0.000 | 0.083 |
0.460 0.315 | 0.502 |
0.312 0.261 | 0.345 |
0.000 0.000 | 0.000 |
| 3 spectra, ISDLGVAEALHPFAVDDTCR | 0.000 | 0.111 | 0.119 | 0.000 | 0.000 | 0.486 | 0.283 | 0.000 | ||
| 2 spectra, IDSTEVIYQPR | 0.000 | 0.171 | 0.067 | 0.000 | 0.000 | 0.709 | 0.053 | 0.000 | ||
| 1 spectrum, FPVCQAHGYFR | 0.191 | 0.085 | 0.231 | 0.000 | 0.221 | 0.091 | 0.180 | 0.000 | ||
| 2 spectra, LFENIGR | 0.000 | 0.201 | 0.000 | 0.000 | 0.000 | 0.181 | 0.617 | 0.000 |
| Plot | Lyso | Other | |||||||||||
| Expt C |
6 peptides |
7 spectra |
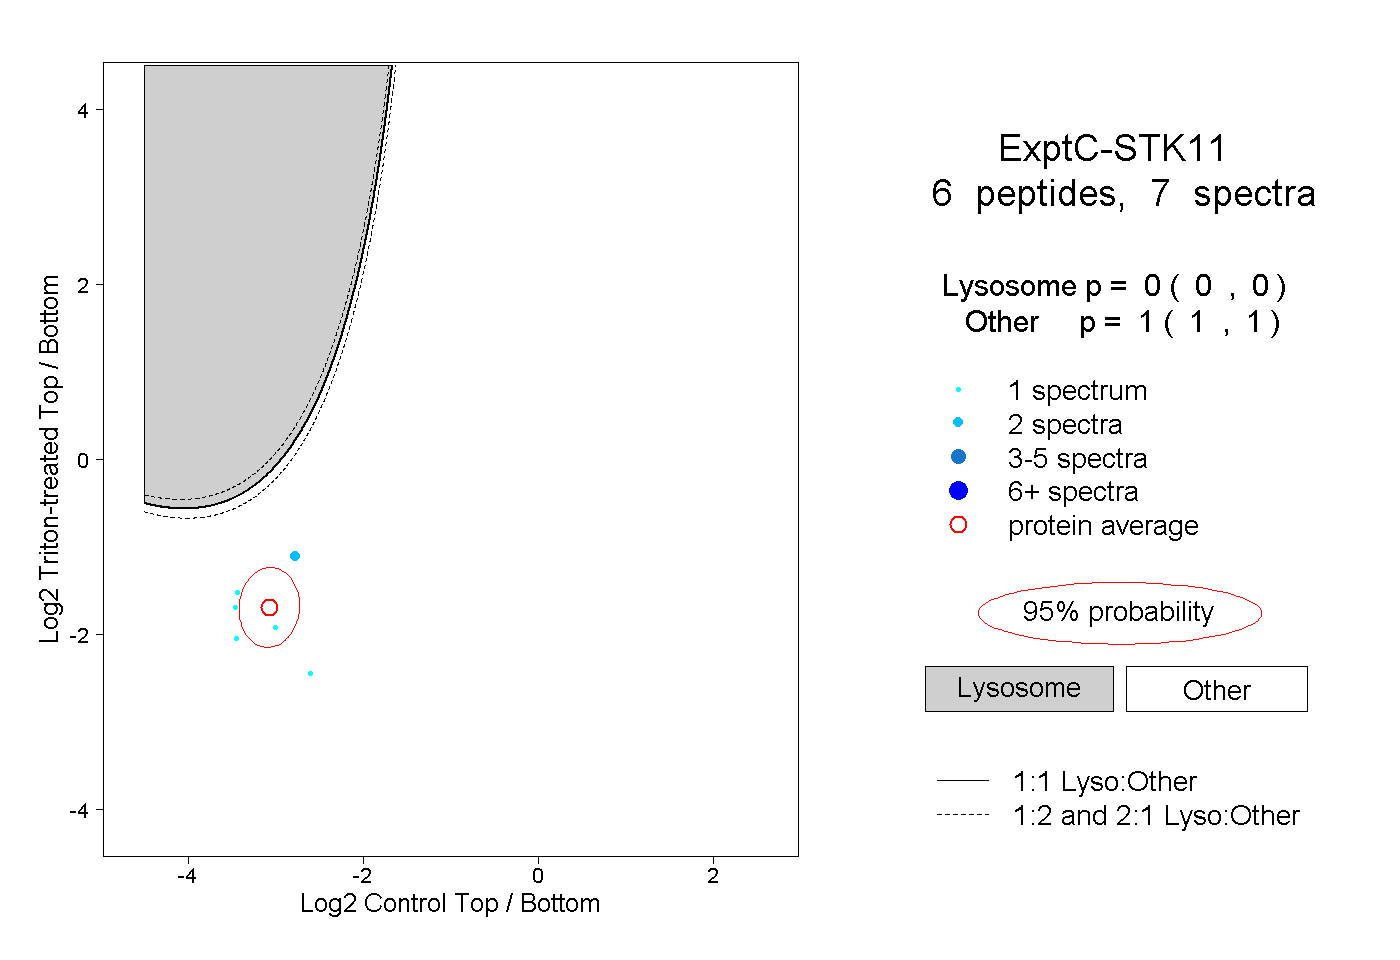 |
0.000 0.000 | 0.000 |
1.000 1.000 | 1.000 |