6
6peptides
spectra
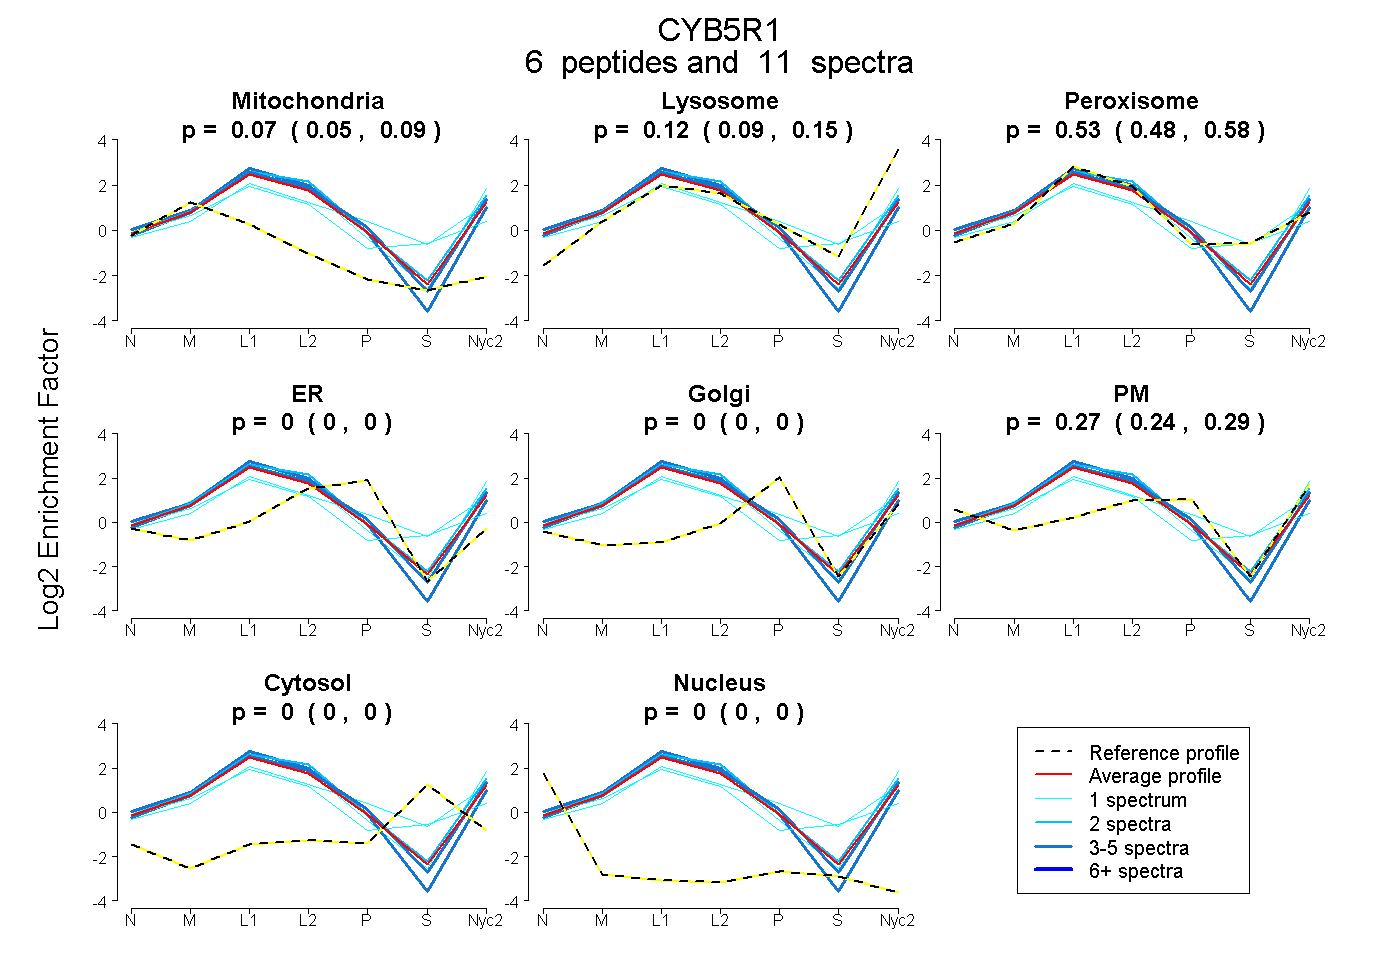
0.050 | 0.091
0.088 | 0.149
0.478 | 0.578
0.000 | 0.000
0.000 | 0.000
0.243 | 0.295
0.000 | 0.000
0.000 | 0.000
4peptides
spectra
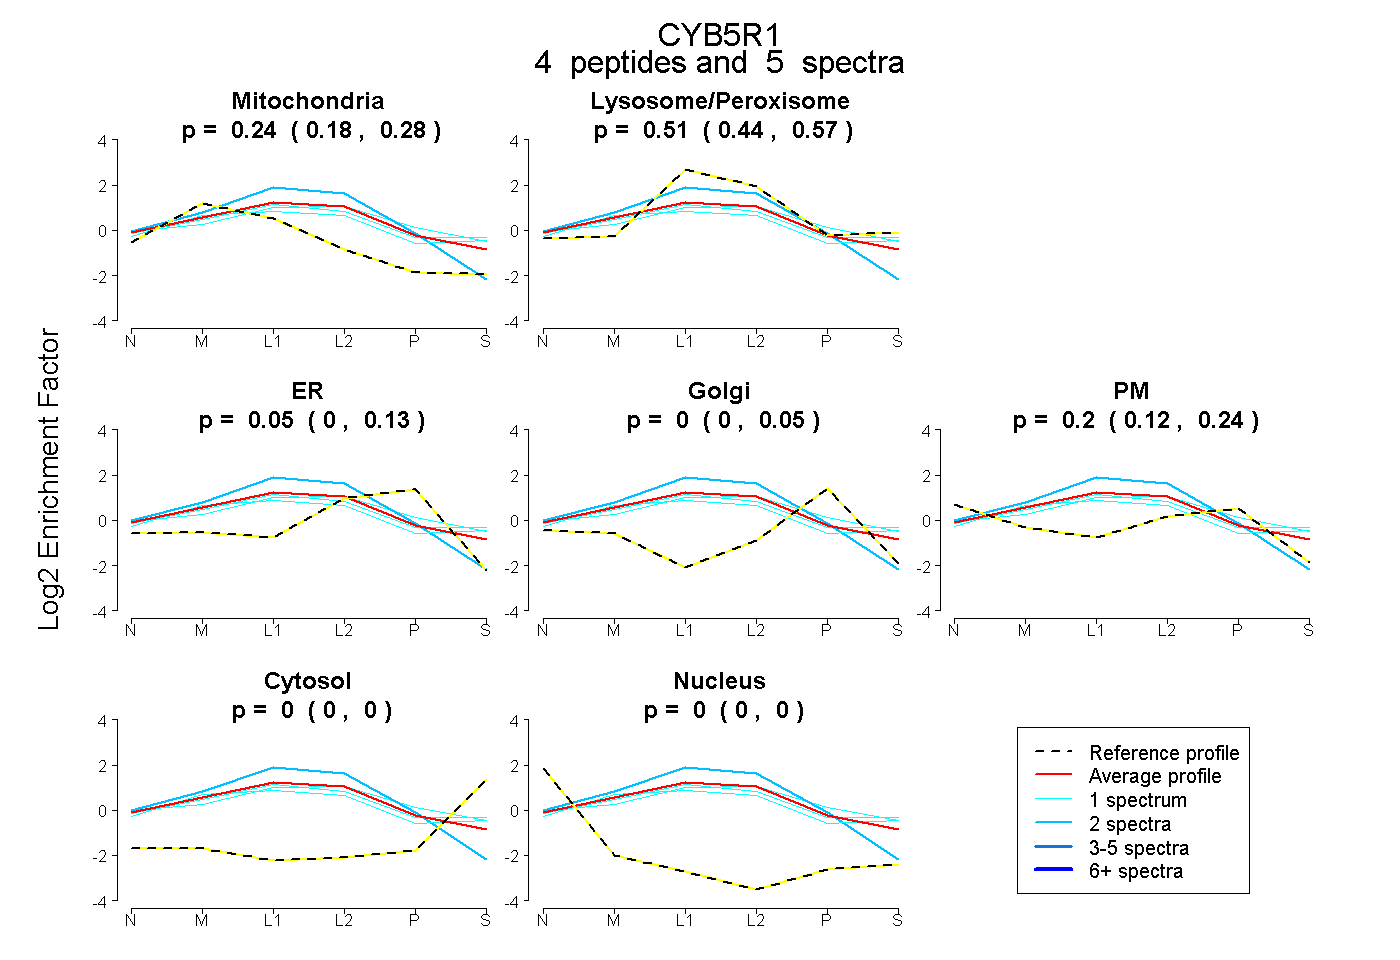
0.182 | 0.280
0.444 | 0.569
0.000 | 0.132
0.000 | 0.047
0.119 | 0.240
0.000 | 0.000
0.000 | 0.000
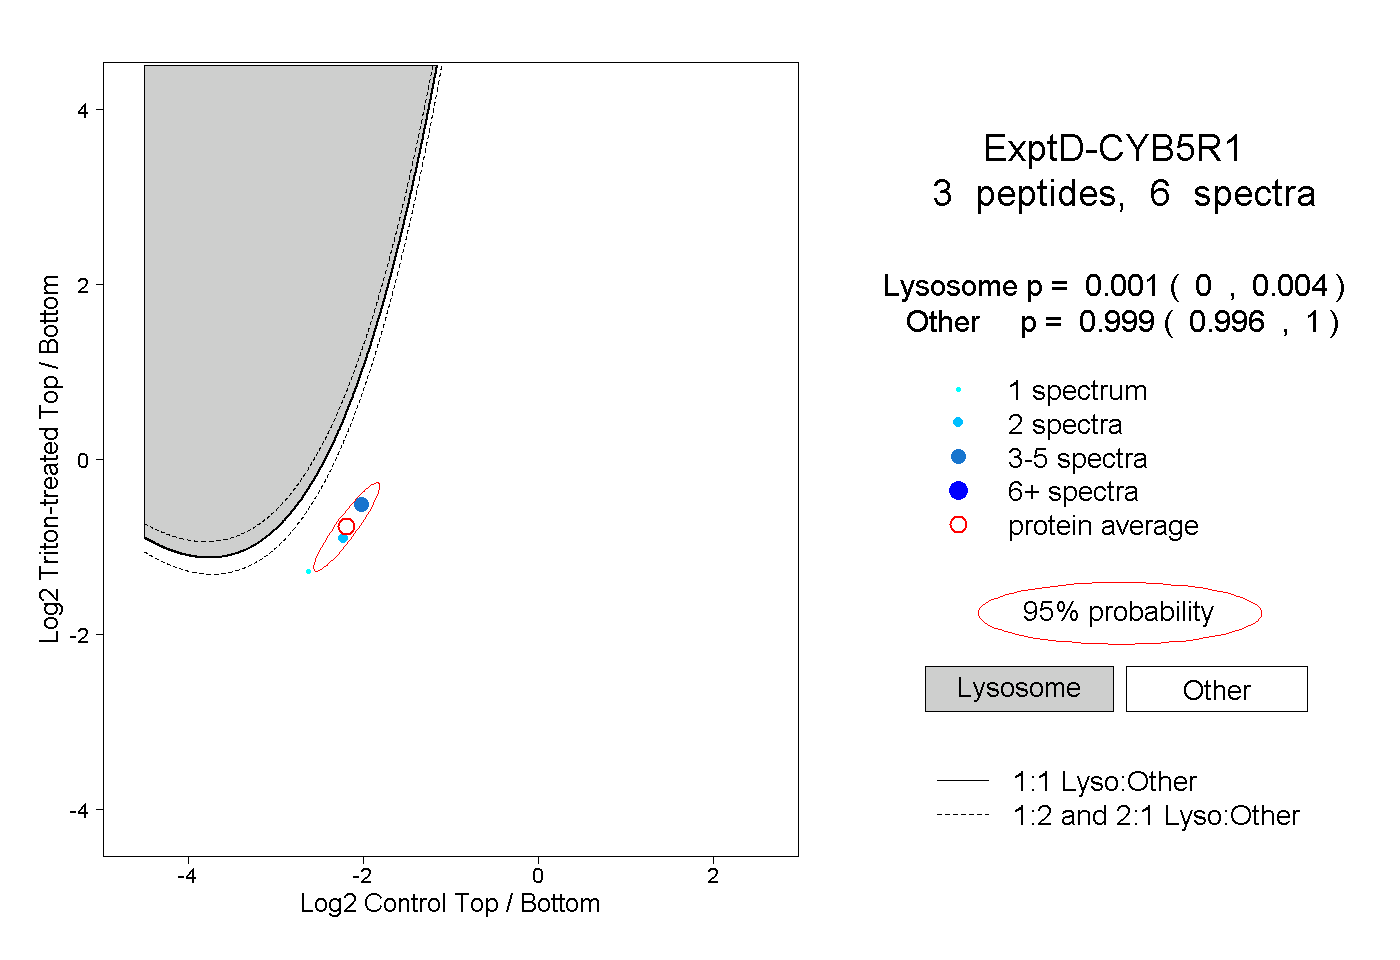
9peptides
spectra
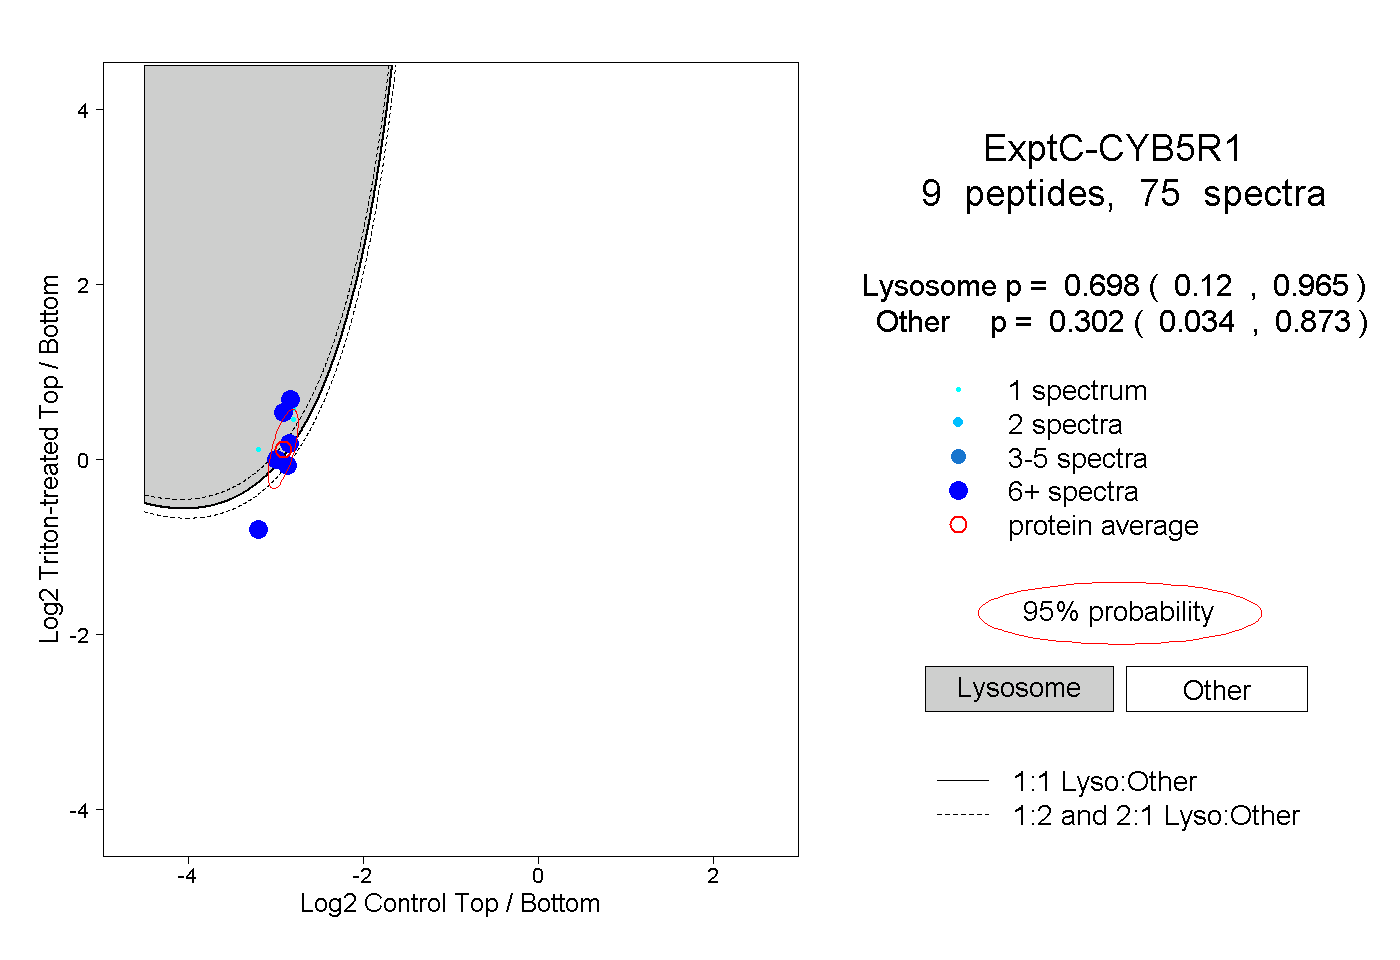
0.120 | 0.965
0.034 | 0.873