 6
6peptides
spectra
0.050 | 0.091
0.088 | 0.149
0.478 | 0.578
0.000 | 0.000
0.000 | 0.000
0.243 | 0.295
0.000 | 0.000
0.000 | 0.000
| Plot | Mito | Lyso | Perox | ER | Golgi | PM | Cytosol | Nucleus | |||||
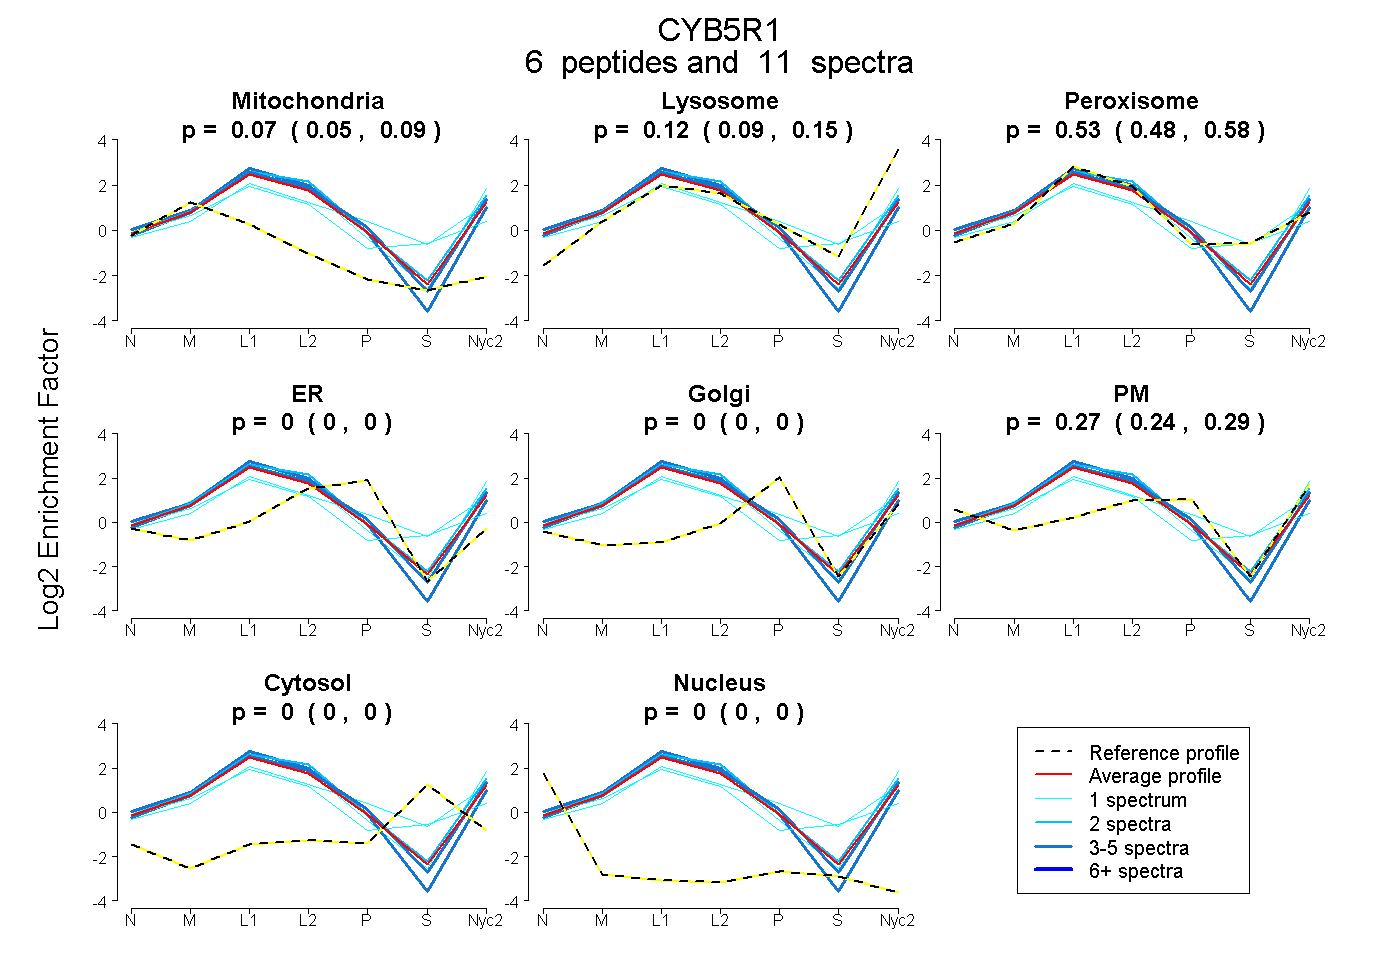
| Expt A |
6 peptides |
11 spectra |
|
0.072 0.050 | 0.091 |
0.123 0.088 | 0.149 |
0.533 0.478 | 0.578 |
0.000 0.000 | 0.000 |
0.000 0.000 | 0.000 |
0.273 0.243 | 0.295 |
0.000 0.000 | 0.000 |
0.000 0.000 | 0.000 |
| 3 spectra, FALPTAHHILGLPVGK | 0.093 | 0.042 | 0.499 | 0.023 | 0.000 | 0.343 | 0.000 | 0.000 | ||
| 2 spectra, IGDVVEFR | 0.000 | 0.157 | 0.603 | 0.000 | 0.000 | 0.240 | 0.000 | 0.000 | ||
| 1 spectrum, VPEDPTQCFLLFANQTEK | 0.167 | 0.000 | 0.738 | 0.000 | 0.000 | 0.048 | 0.048 | 0.000 | ||
| 3 spectra, MSQYLDSLK | 0.050 | 0.182 | 0.464 | 0.056 | 0.000 | 0.248 | 0.000 | 0.000 | ||
| 1 spectrum, HVYLSAR | 0.000 | 0.112 | 0.678 | 0.000 | 0.173 | 0.036 | 0.000 | 0.000 | ||
| 1 spectrum, EDLEELQAQYPIR | 0.062 | 0.291 | 0.463 | 0.000 | 0.000 | 0.184 | 0.000 | 0.000 |
| Plot | Mito | Lyso or Perox | ER | Golgi | PM | Cytosol | Nucleus | ||||||
| Expt B |
4 peptides |
5 spectra |
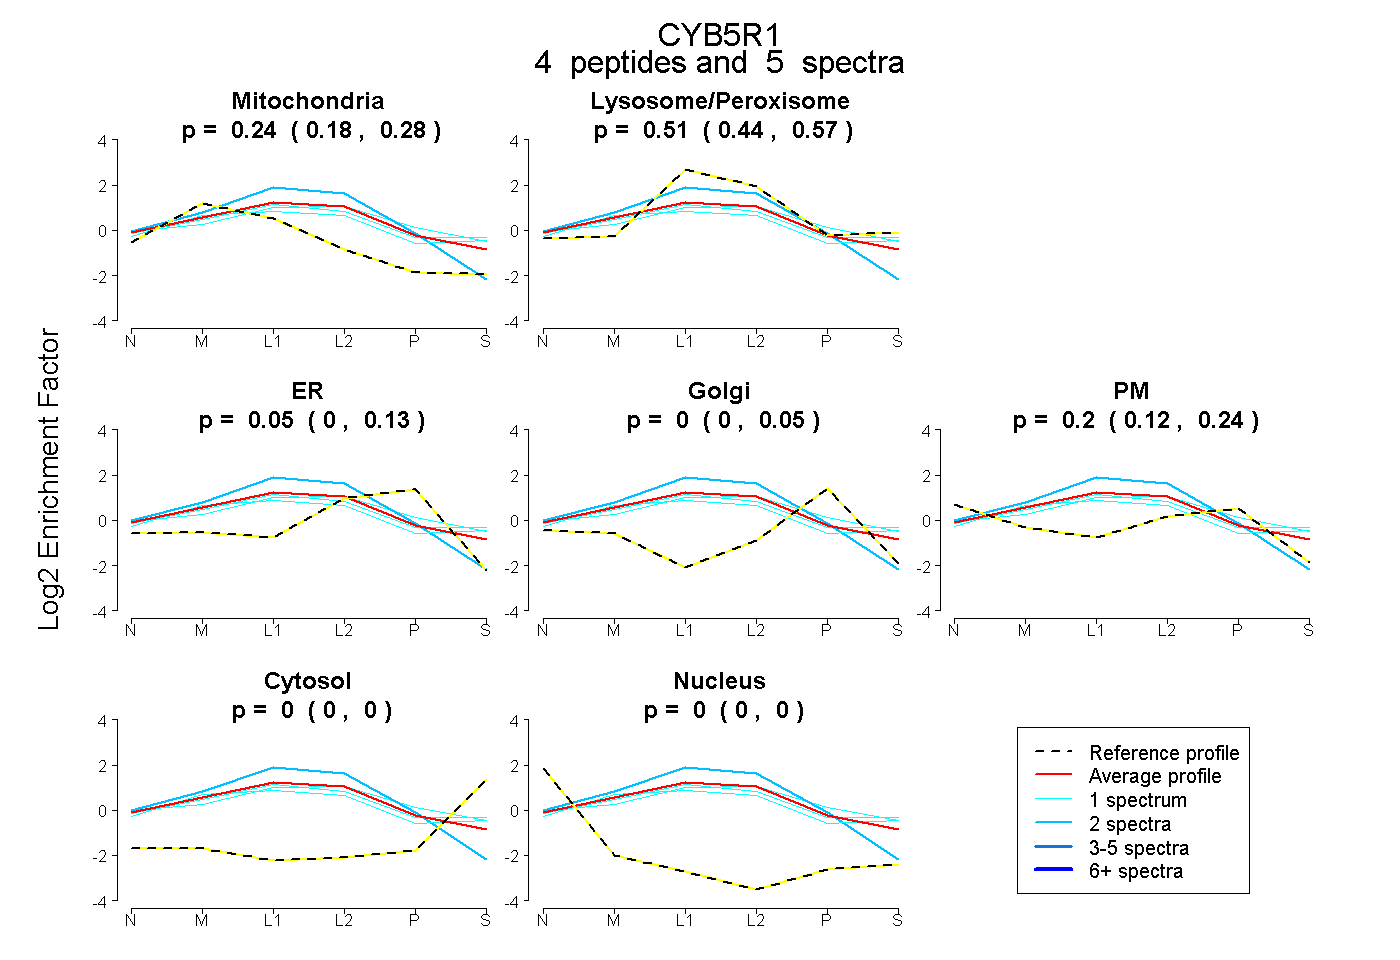 |
0.235 0.182 | 0.280 |
0.513 0.444 | 0.569 |
0.047 0.000 | 0.132 |
0.000 0.000 | 0.047 |
0.205 0.119 | 0.240 |
0.000 0.000 | 0.000 |
0.000 0.000 | 0.000 |
|||
| Plot | Lyso | Other | |||||||||||
| Expt C |
9 peptides |
75 spectra |
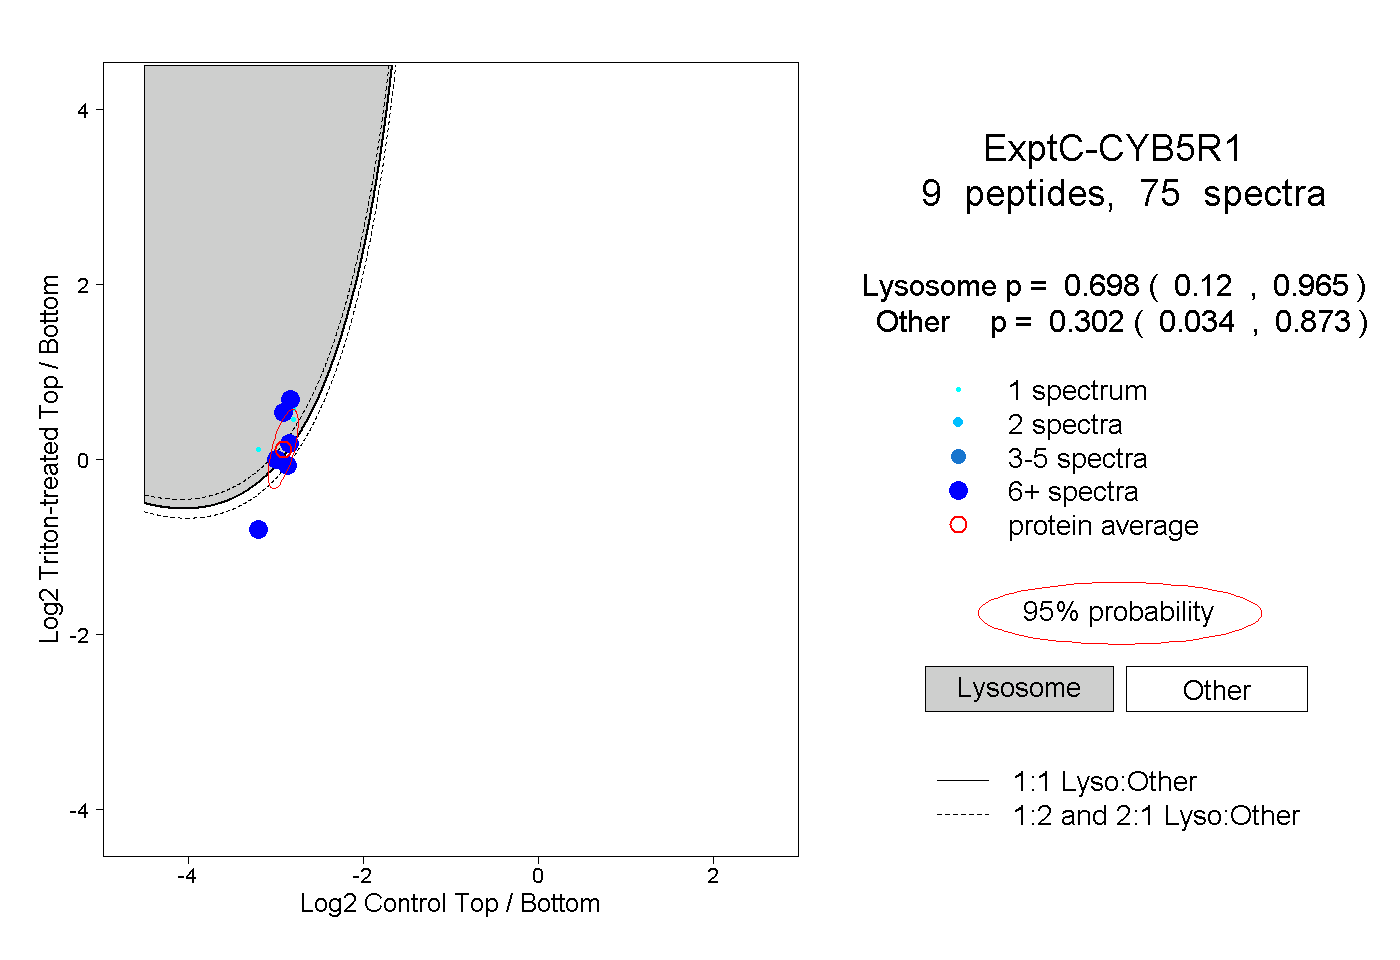 |
0.698 0.120 | 0.965 |
0.302 0.034 | 0.873 |
||||||||
| Plot | Lyso | Other | |||||||||||
| Expt D |
3 peptides |
6 spectra |
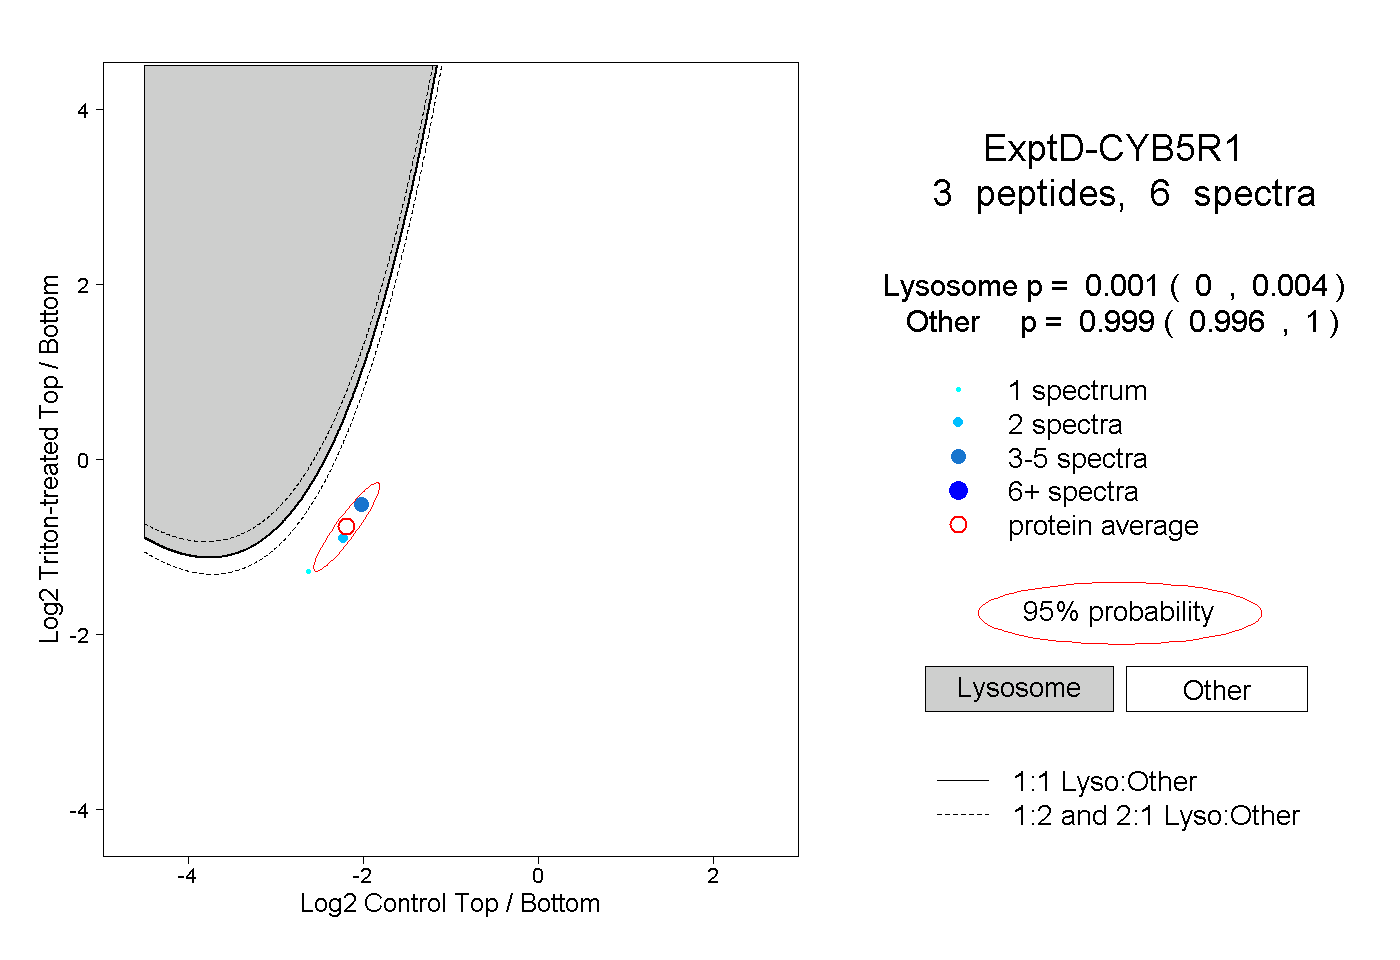 |
0.001 0.000 | 0.004 |
0.999 0.996 | 1.000 |