26
26peptides
spectra
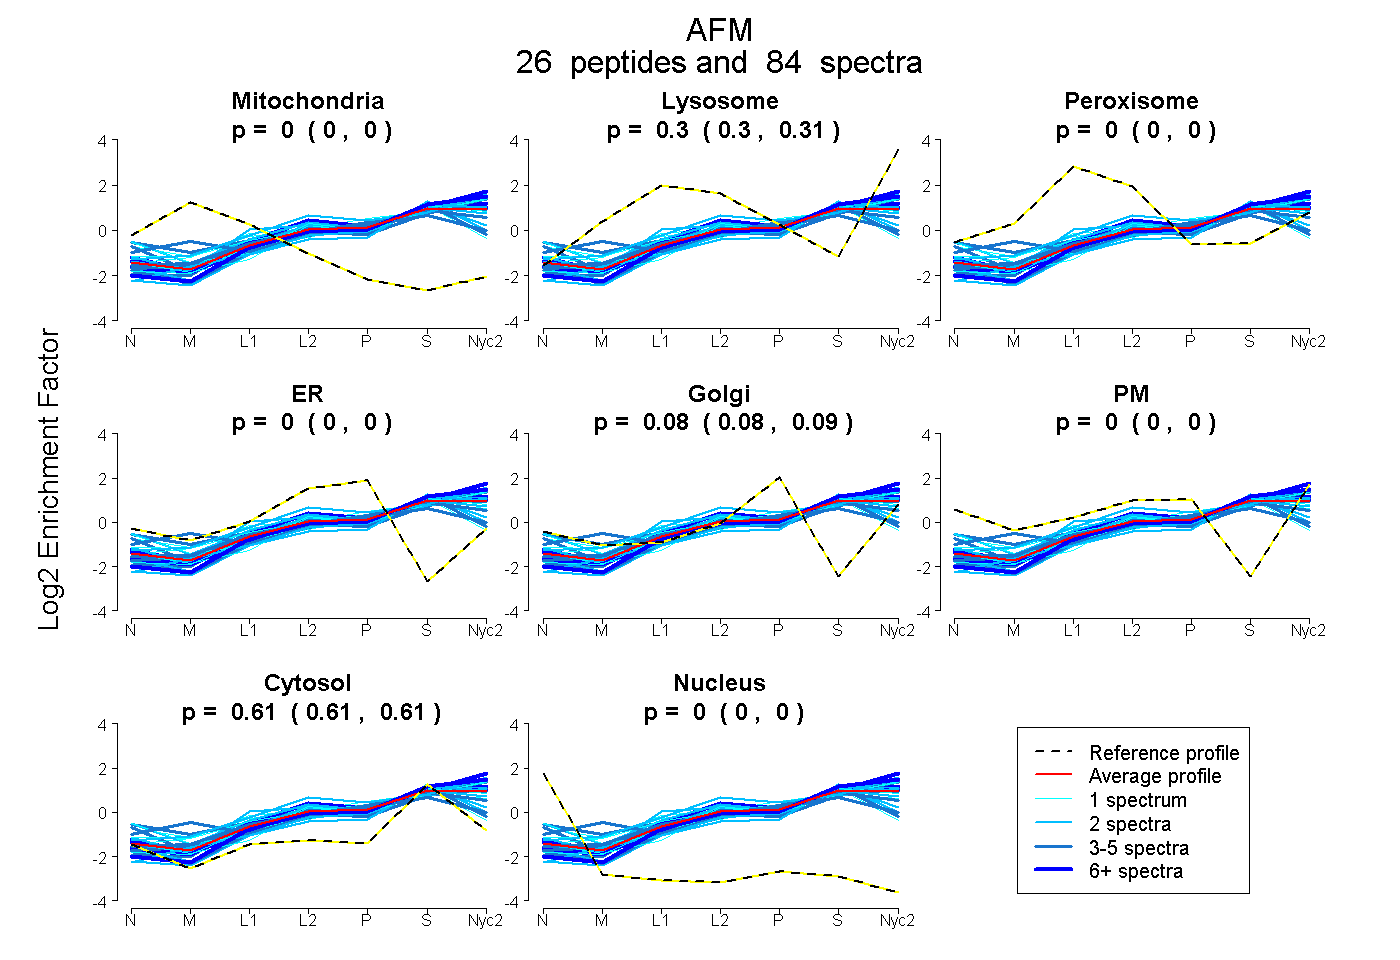
0.000 | 0.000
0.301 | 0.307
0.000 | 0.000
0.000 | 0.000
0.081 | 0.086
0.000 | 0.000
0.609 | 0.613
0.000 | 0.000
13peptides
spectra
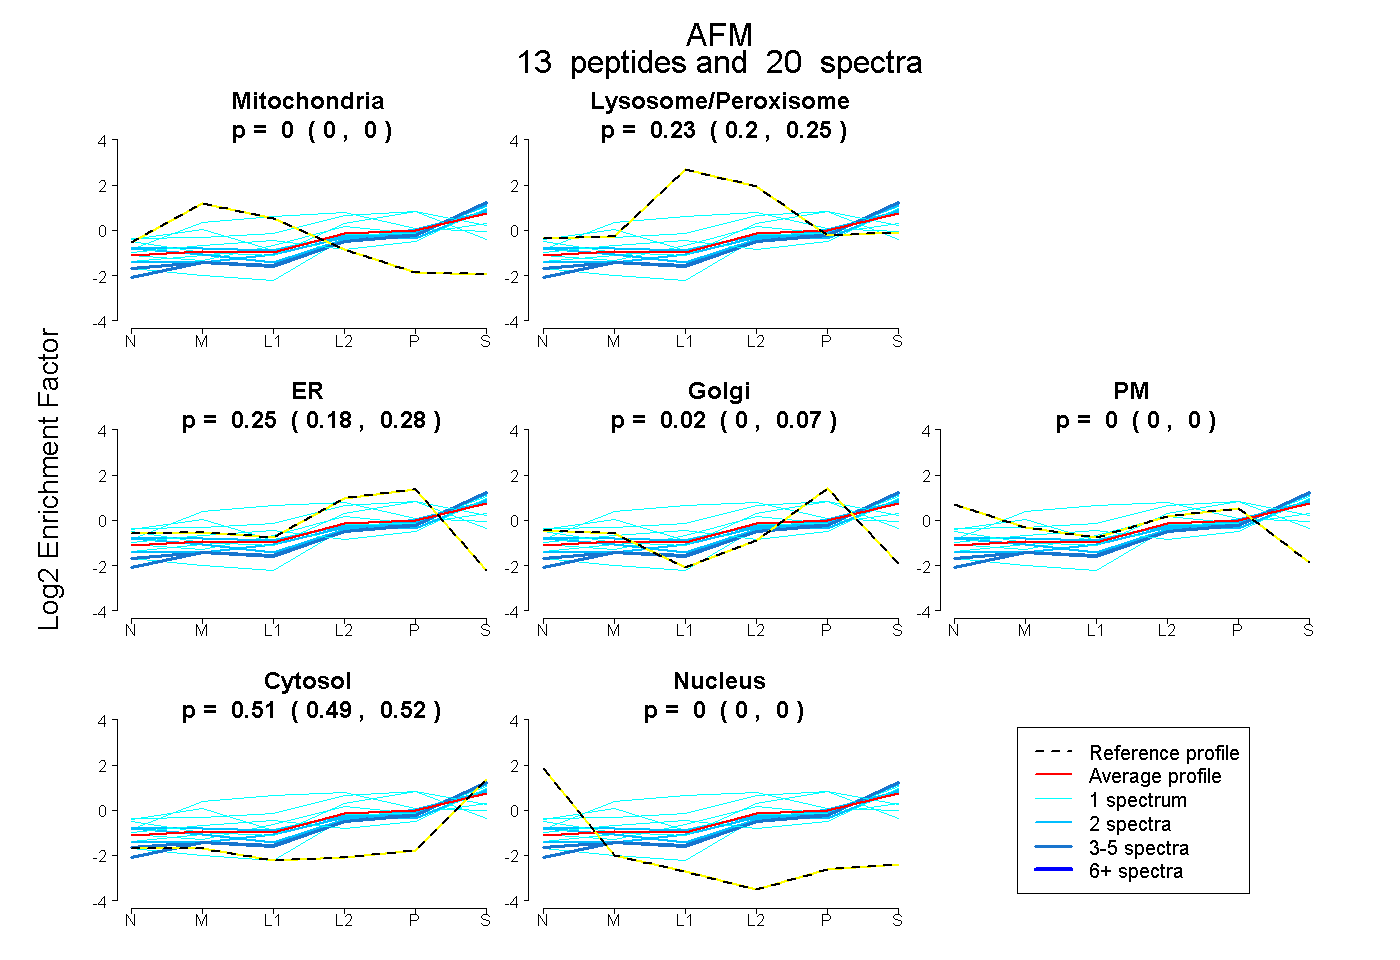
0.000 | 0.000
0.204 | 0.251
0.175 | 0.277
0.000 | 0.072
0.000 | 0.000
0.488 | 0.521
0.000 | 0.000