 30
30peptides
spectra
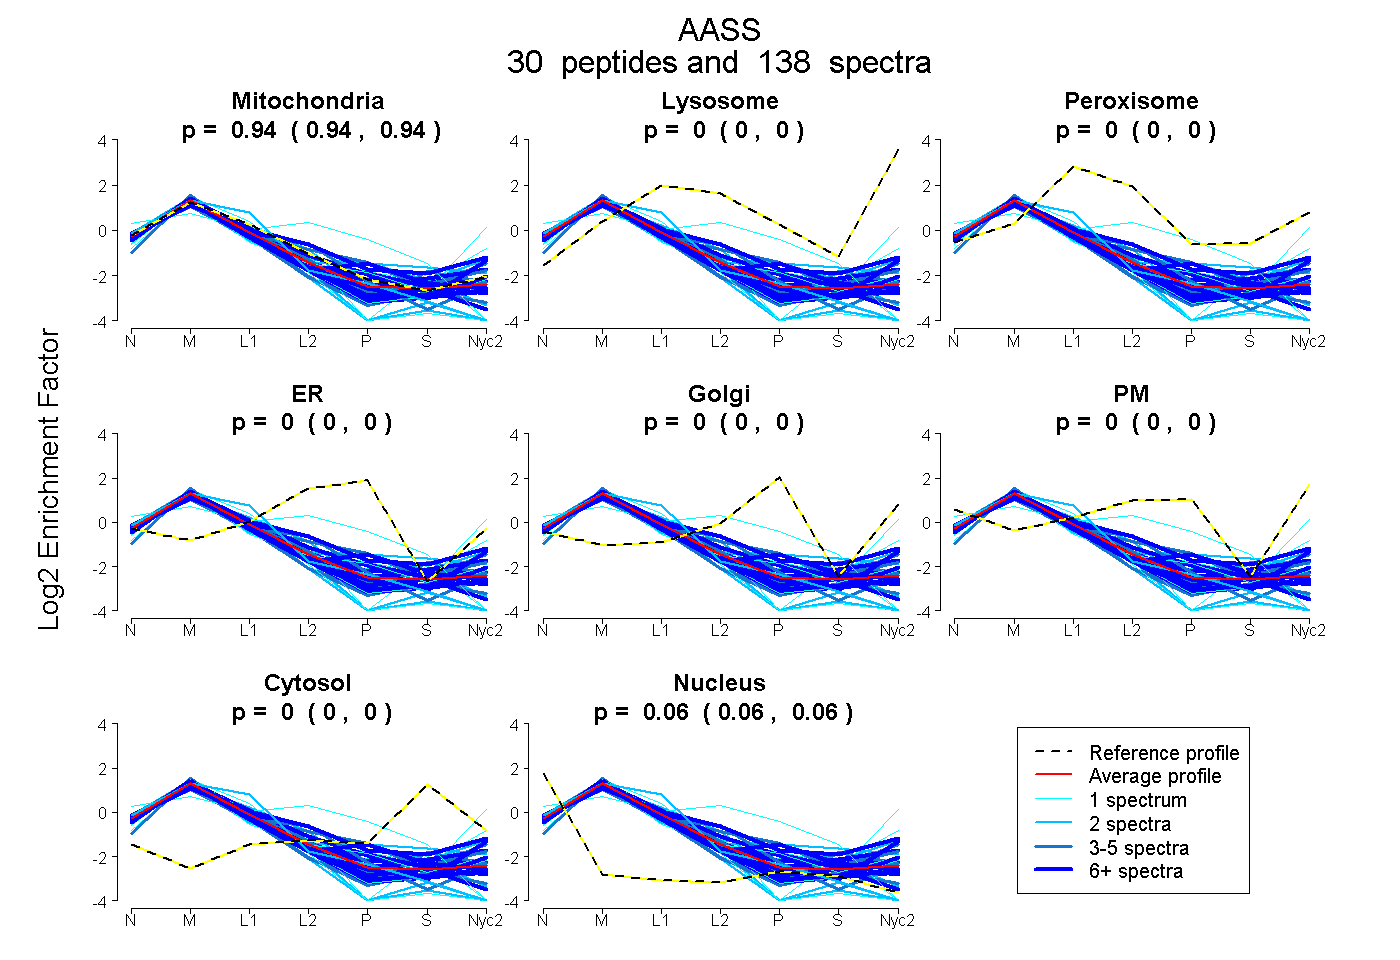
0.936 | 0.939
0.000 | 0.000
0.000 | 0.000
0.000 | 0.000
0.000 | 0.000
0.000 | 0.000
0.000 | 0.000
0.061 | 0.064
21peptides
spectra
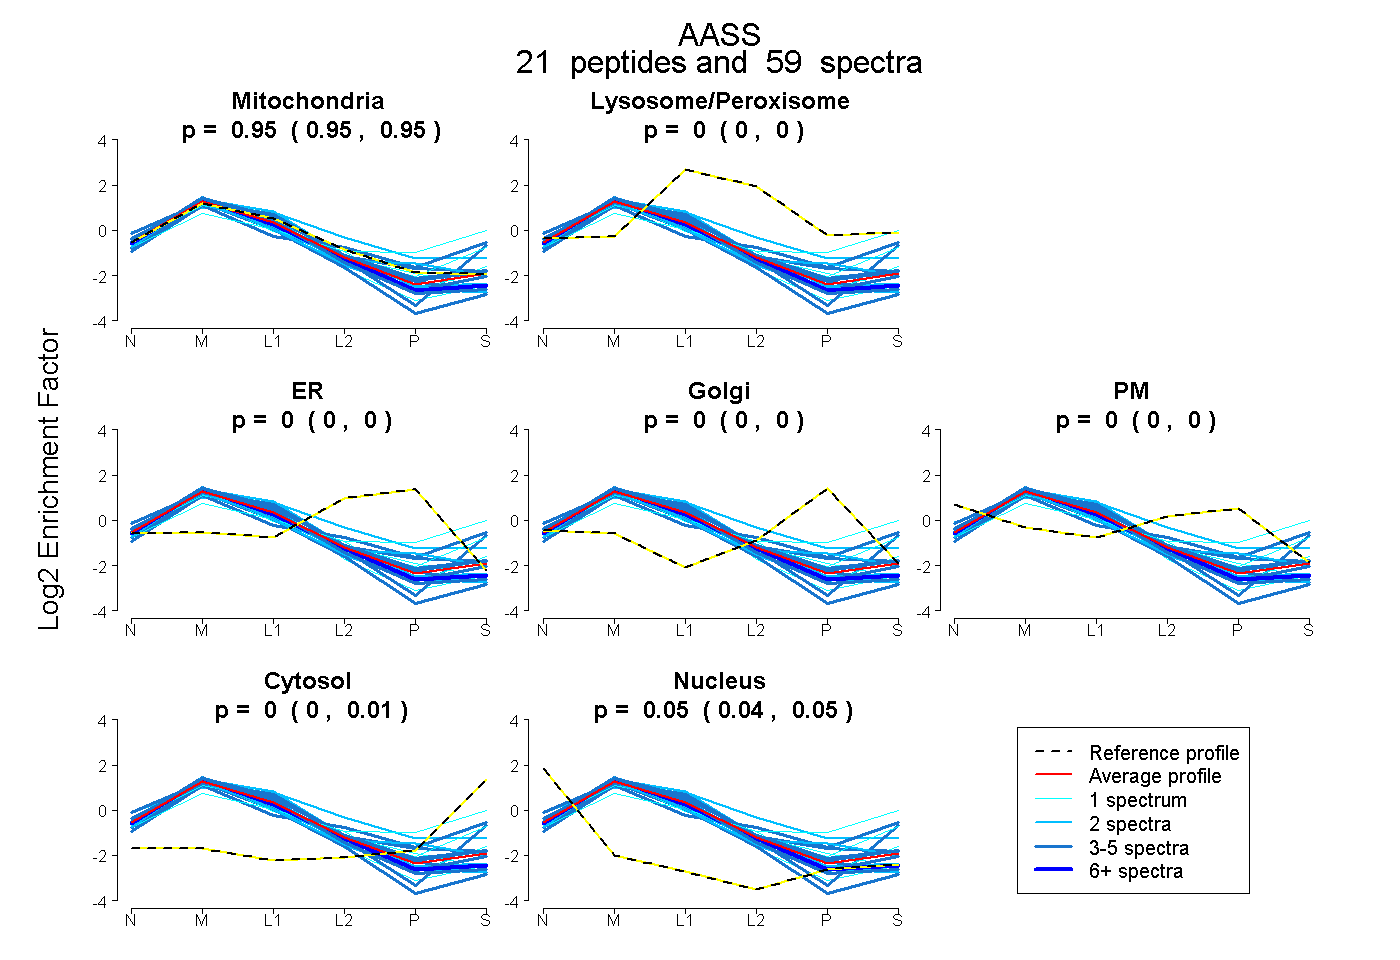
0.947 | 0.953
0.000 | 0.000
0.000 | 0.000
0.000 | 0.000
0.000 | 0.000
0.000 | 0.007
0.043 | 0.050
33peptides
spectra
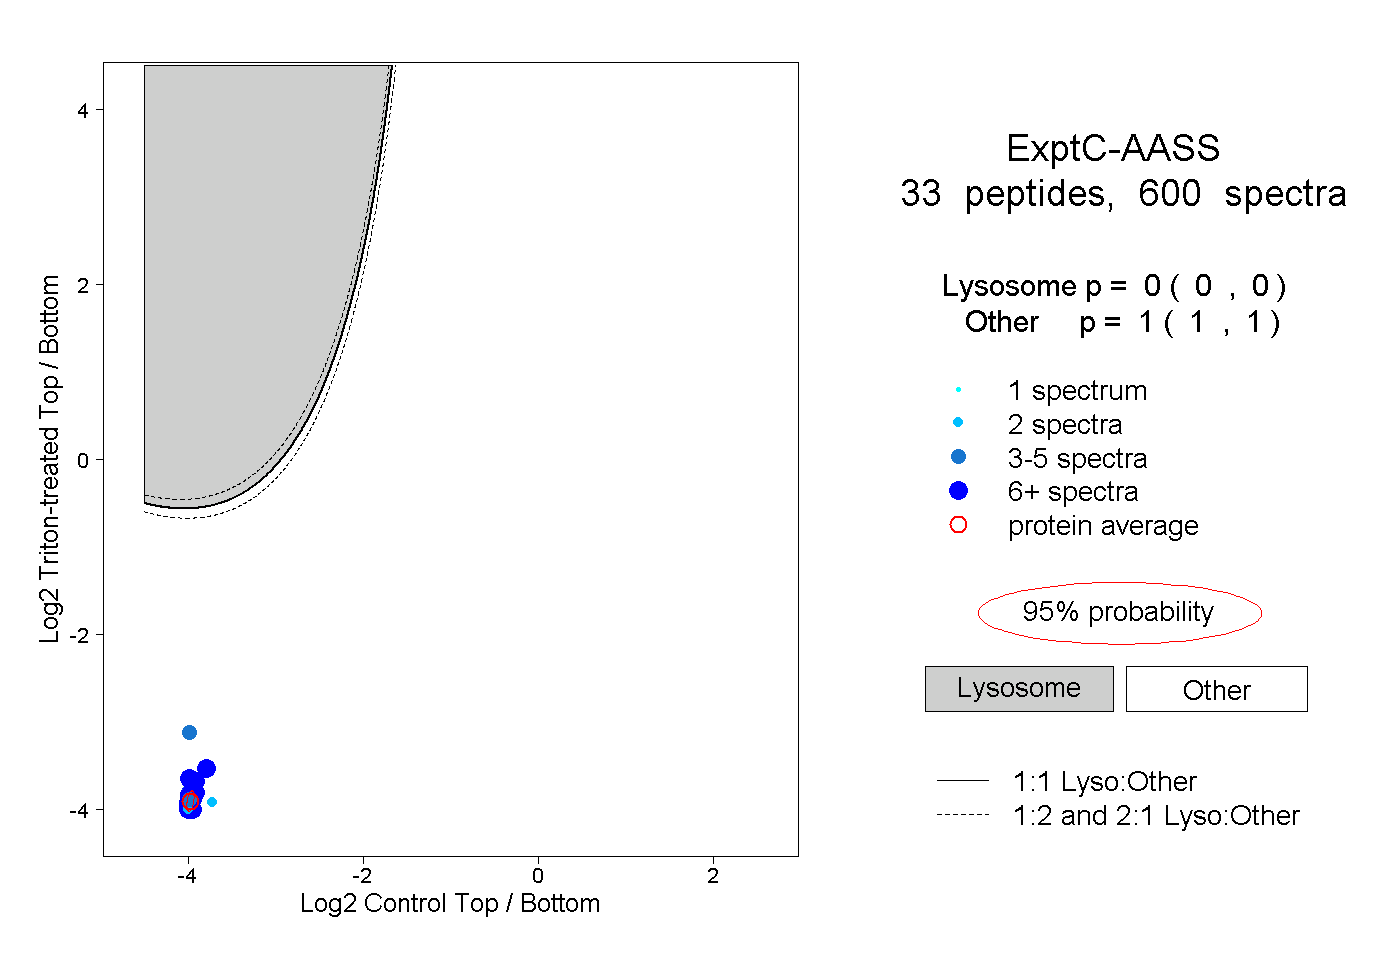
0.000 | 0.000
1.000 | 1.000
16peptides
spectra
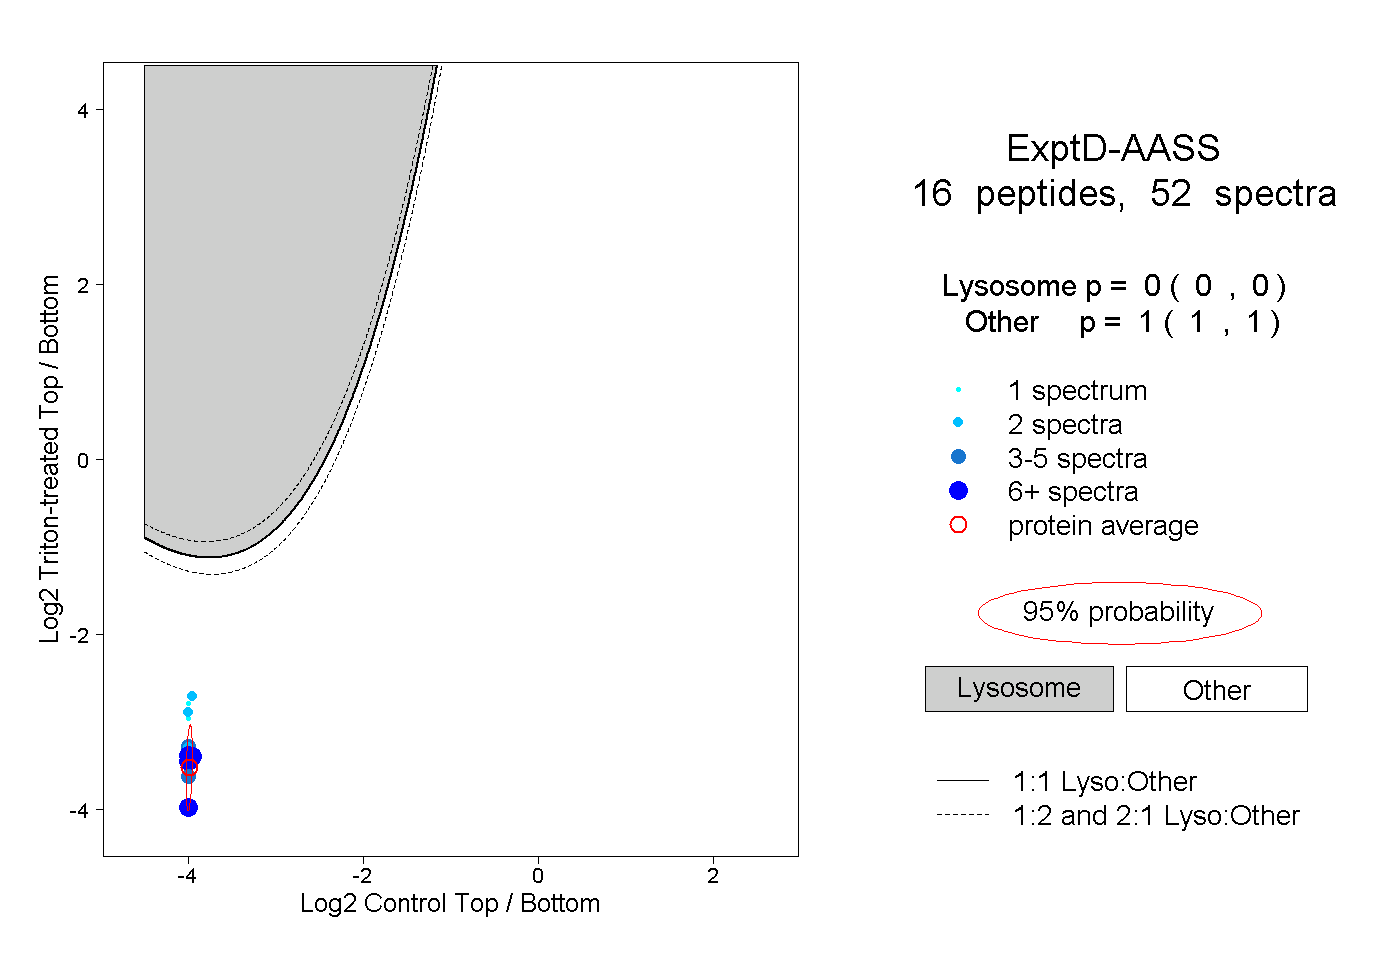
0.000 | 0.000
1.000 | 1.000