21
21peptides
spectra
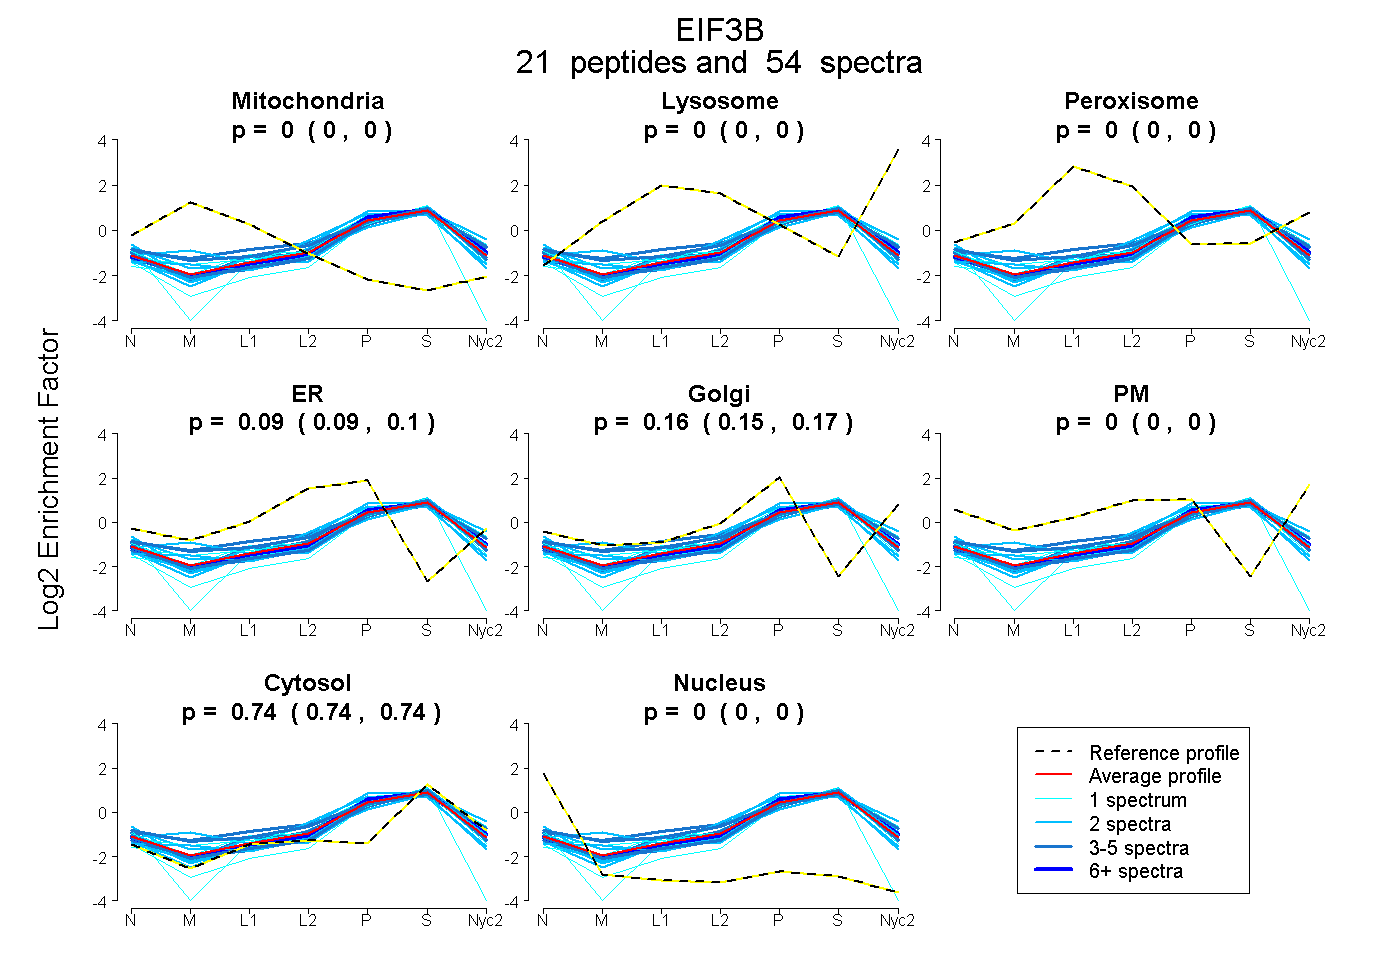
0.000 | 0.000
0.000 | 0.000
0.000 | 0.000
0.086 | 0.103
0.153 | 0.173
0.000 | 0.000
0.739 | 0.743
0.000 | 0.000
9peptides
spectra
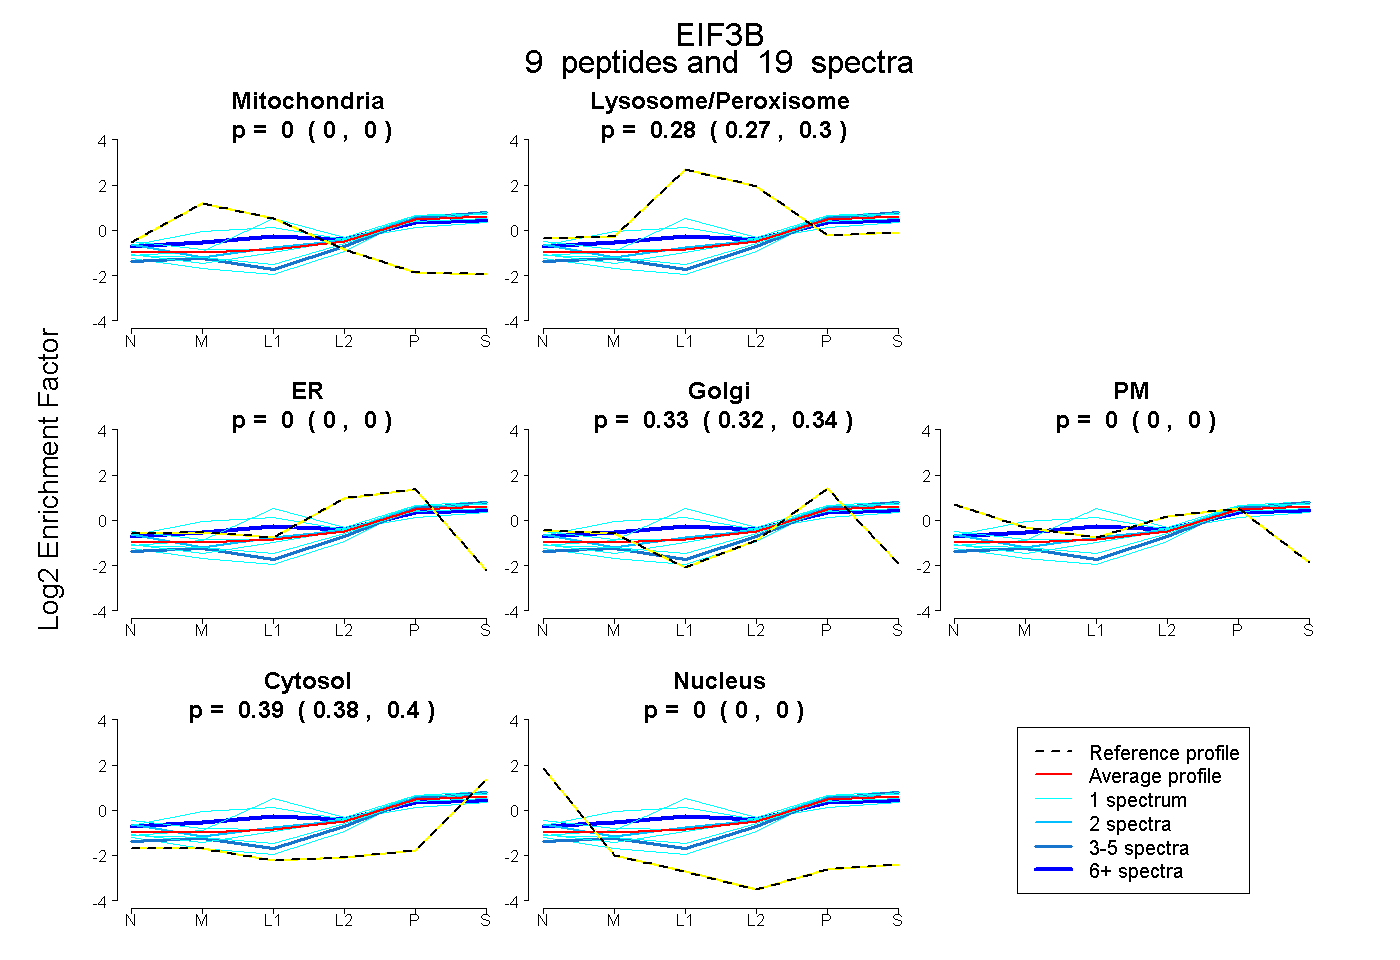
0.000 | 0.000
0.266 | 0.297
0.000 | 0.000
0.316 | 0.338
0.000 | 0.000
0.381 | 0.396
0.000 | 0.000