 21
21peptides
spectra
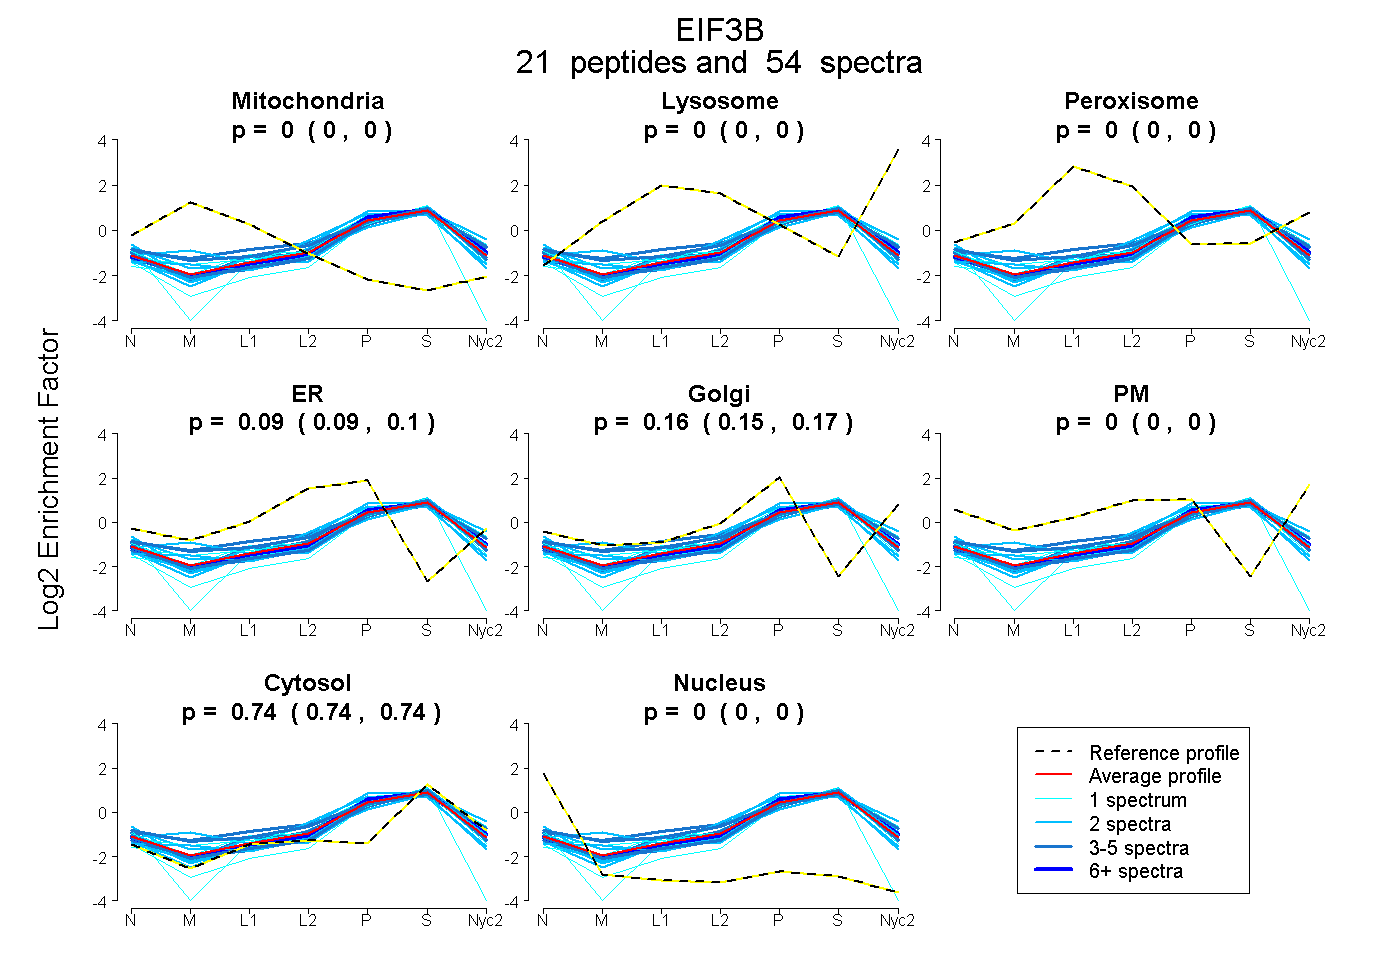
0.000 | 0.000
0.000 | 0.000
0.000 | 0.000
0.086 | 0.103
0.153 | 0.173
0.000 | 0.000
0.739 | 0.743
0.000 | 0.000
| Plot | Mito | Lyso | Perox | ER | Golgi | PM | Cytosol | Nucleus | |||||
| Expt A |
21 peptides |
54 spectra |
|
0.000 0.000 | 0.000 |
0.000 0.000 | 0.000 |
0.000 0.000 | 0.000 |
0.095 0.086 | 0.103 |
0.164 0.153 | 0.173 |
0.000 0.000 | 0.000 |
0.741 0.739 | 0.743 |
0.000 0.000 | 0.000 |
| 3 spectra, VNLFTDFDK | 0.000 | 0.000 | 0.000 | 0.000 | 0.222 | 0.000 | 0.778 | 0.000 | ||
| 3 spectra, QVPVDVVEMK | 0.000 | 0.000 | 0.000 | 0.102 | 0.125 | 0.000 | 0.774 | 0.000 | ||
| 15 spectra, VTLMQLPTR | 0.000 | 0.000 | 0.000 | 0.014 | 0.259 | 0.000 | 0.728 | 0.000 | ||
| 1 spectrum, MTLDTLSIYETPSMGLLDK | 0.000 | 0.000 | 0.002 | 0.061 | 0.207 | 0.000 | 0.730 | 0.000 | ||
| 1 spectrum, MAQELYMK | 0.000 | 0.000 | 0.000 | 0.032 | 0.204 | 0.000 | 0.764 | 0.000 | ||
| 1 spectrum, VDNAYWLWTFQGR | 0.000 | 0.000 | 0.000 | 0.096 | 0.194 | 0.000 | 0.710 | 0.000 | ||
| 1 spectrum, DPVSIEER | 0.000 | 0.000 | 0.000 | 0.248 | 0.014 | 0.000 | 0.739 | 0.000 | ||
| 3 spectra, WSHDGK | 0.000 | 0.000 | 0.013 | 0.156 | 0.174 | 0.000 | 0.657 | 0.000 | ||
| 1 spectrum, DQYSVIFESGDR | 0.000 | 0.000 | 0.000 | 0.000 | 0.146 | 0.000 | 0.854 | 0.000 | ||
| 3 spectra, YWLEEAECR | 0.000 | 0.000 | 0.000 | 0.000 | 0.224 | 0.000 | 0.776 | 0.000 | ||
| 3 spectra, GIALWGGDK | 0.000 | 0.000 | 0.000 | 0.027 | 0.266 | 0.000 | 0.708 | 0.000 | ||
| 2 spectra, TMMEDFR | 0.000 | 0.000 | 0.000 | 0.043 | 0.296 | 0.000 | 0.660 | 0.000 | ||
| 2 spectra, NLFNVVDCK | 0.000 | 0.000 | 0.000 | 0.323 | 0.000 | 0.000 | 0.669 | 0.008 | ||
| 2 spectra, GTYLATFHQR | 0.000 | 0.000 | 0.000 | 0.000 | 0.197 | 0.000 | 0.803 | 0.000 | ||
| 3 spectra, FSHQGVQLIDFSPCER | 0.000 | 0.000 | 0.028 | 0.299 | 0.000 | 0.000 | 0.673 | 0.000 | ||
| 2 spectra, DLGNLR | 0.000 | 0.000 | 0.000 | 0.000 | 0.241 | 0.000 | 0.759 | 0.000 | ||
| 2 spectra, WTETYVR | 0.000 | 0.000 | 0.000 | 0.000 | 0.259 | 0.000 | 0.741 | 0.000 | ||
| 1 spectrum, TSIFWNDVK | 0.000 | 0.000 | 0.000 | 0.083 | 0.000 | 0.000 | 0.727 | 0.190 | ||
| 2 spectra, IINDYYPEEDGK | 0.081 | 0.000 | 0.000 | 0.031 | 0.220 | 0.000 | 0.668 | 0.000 | ||
| 2 spectra, FAVLHGEAPR | 0.000 | 0.000 | 0.000 | 0.231 | 0.000 | 0.000 | 0.707 | 0.062 | ||
| 1 spectrum, NADGYK | 0.000 | 0.000 | 0.000 | 0.098 | 0.180 | 0.000 | 0.721 | 0.000 |
| Plot | Mito | Lyso or Perox | ER | Golgi | PM | Cytosol | Nucleus | ||||||
| Expt B |
9 peptides |
19 spectra |
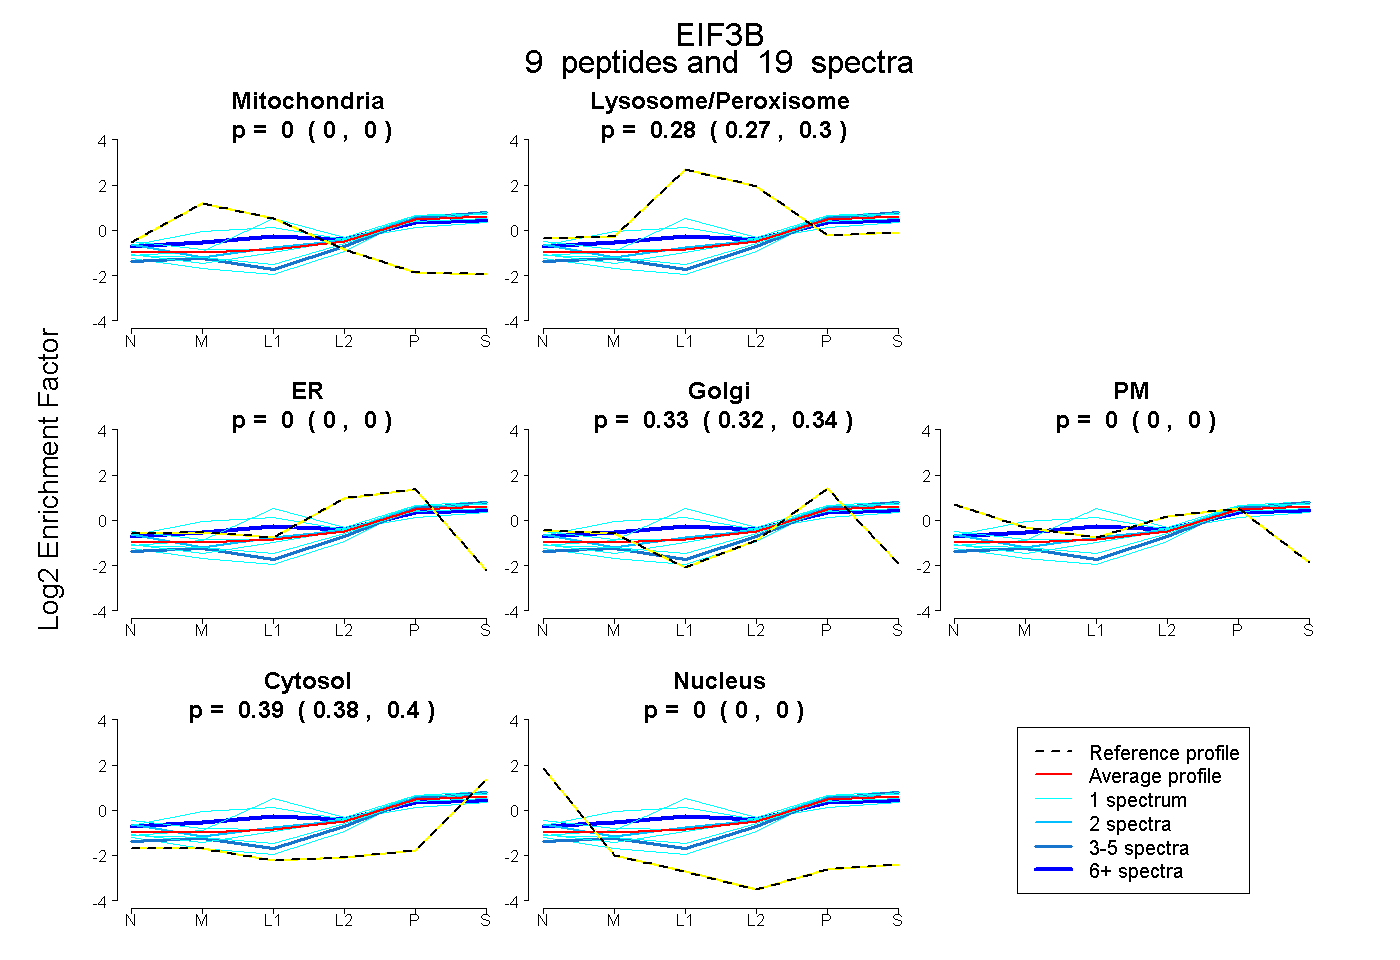 |
0.000 0.000 | 0.000 |
0.282 0.266 | 0.297 |
0.000 0.000 | 0.000 |
0.329 0.316 | 0.338 |
0.000 0.000 | 0.000 |
0.390 0.381 | 0.396 |
0.000 0.000 | 0.000 |
|||
| Plot | Lyso | Other | |||||||||||
| Expt C |
18 peptides |
39 spectra |
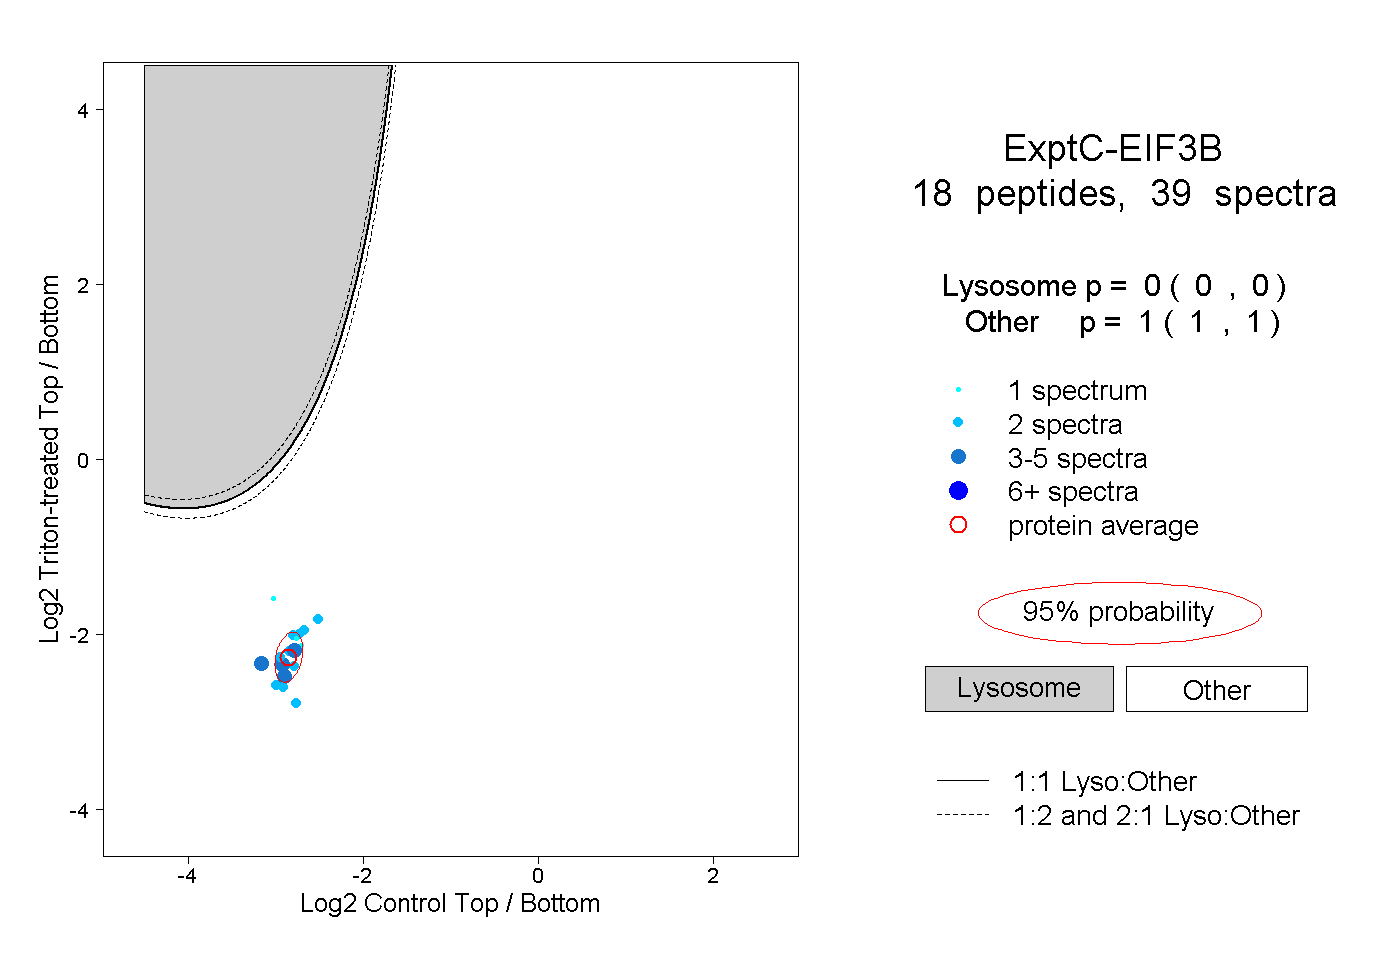 |
0.000 0.000 | 0.000 |
1.000 1.000 | 1.000 |