DIAP1
[ENSRNOP00000057176]
Main page
| | | Plot |
Mito |
Lyso |
|
Perox |
ER |
Golgi |
PM |
Cytosol |
Nucleus |
|
| Expt A |
 28
28
peptides |
67
spectra |
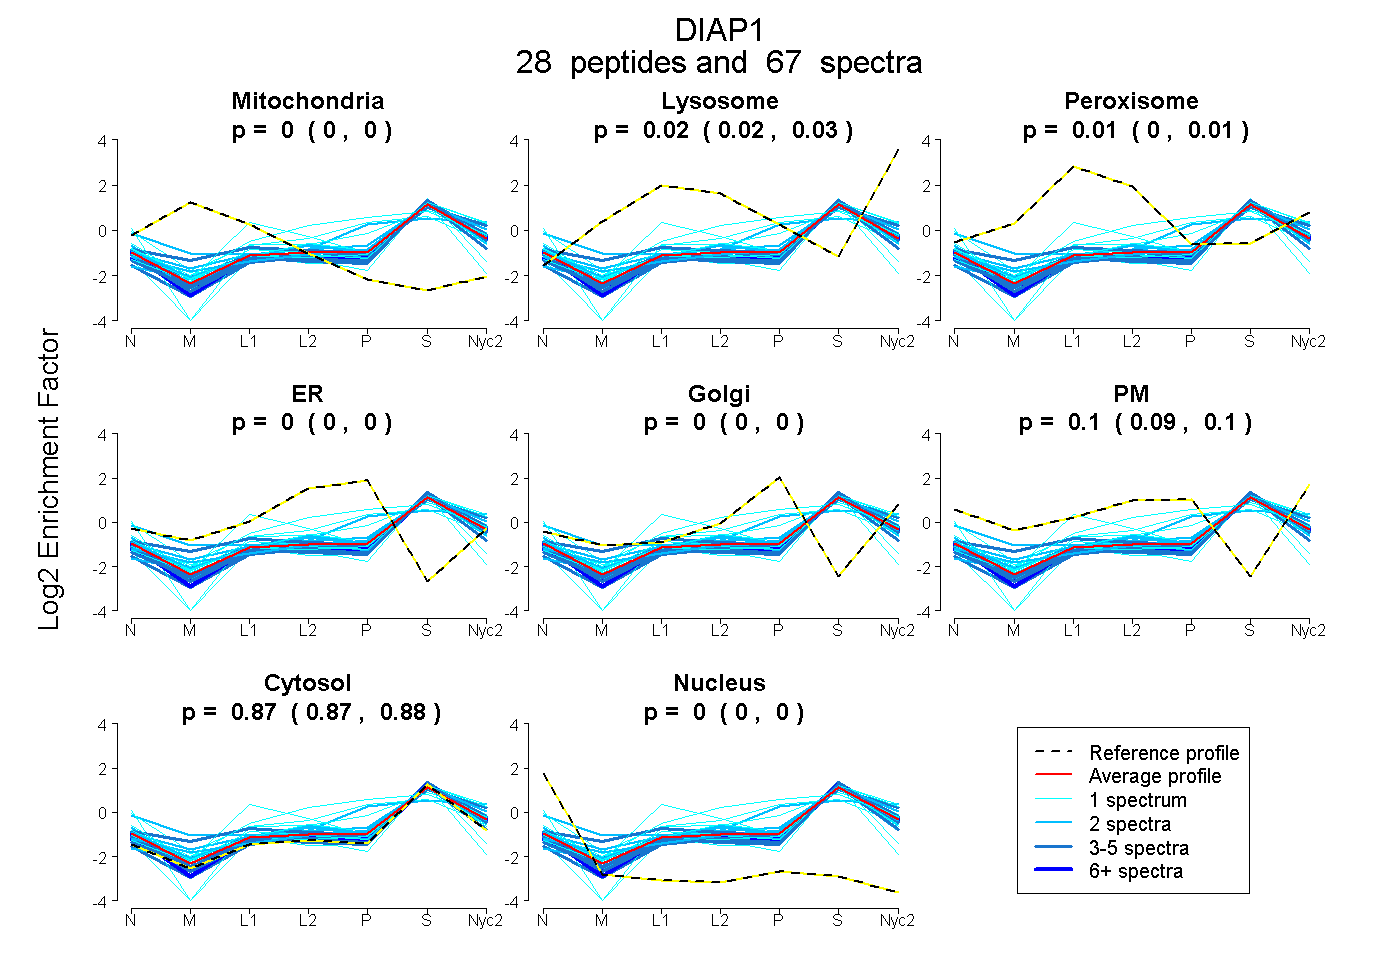 |
0.000
0.000 | 0.000 |
0.022
0.016 | 0.028 |
|
0.008
0.002 | 0.013 |
0.000
0.000 | 0.000 |
0.000
0.000 | 0.000 |
0.096
0.091 | 0.100 |
0.874
0.871 | 0.876 |
0.000
0.000 | 0.000 |
|
| | | Plot |
Mito |
|
Lyso or Perox |
|
ER |
Golgi |
PM |
Cytosol |
Nucleus |
|
| Expt B |
6
peptides |
10
spectra |
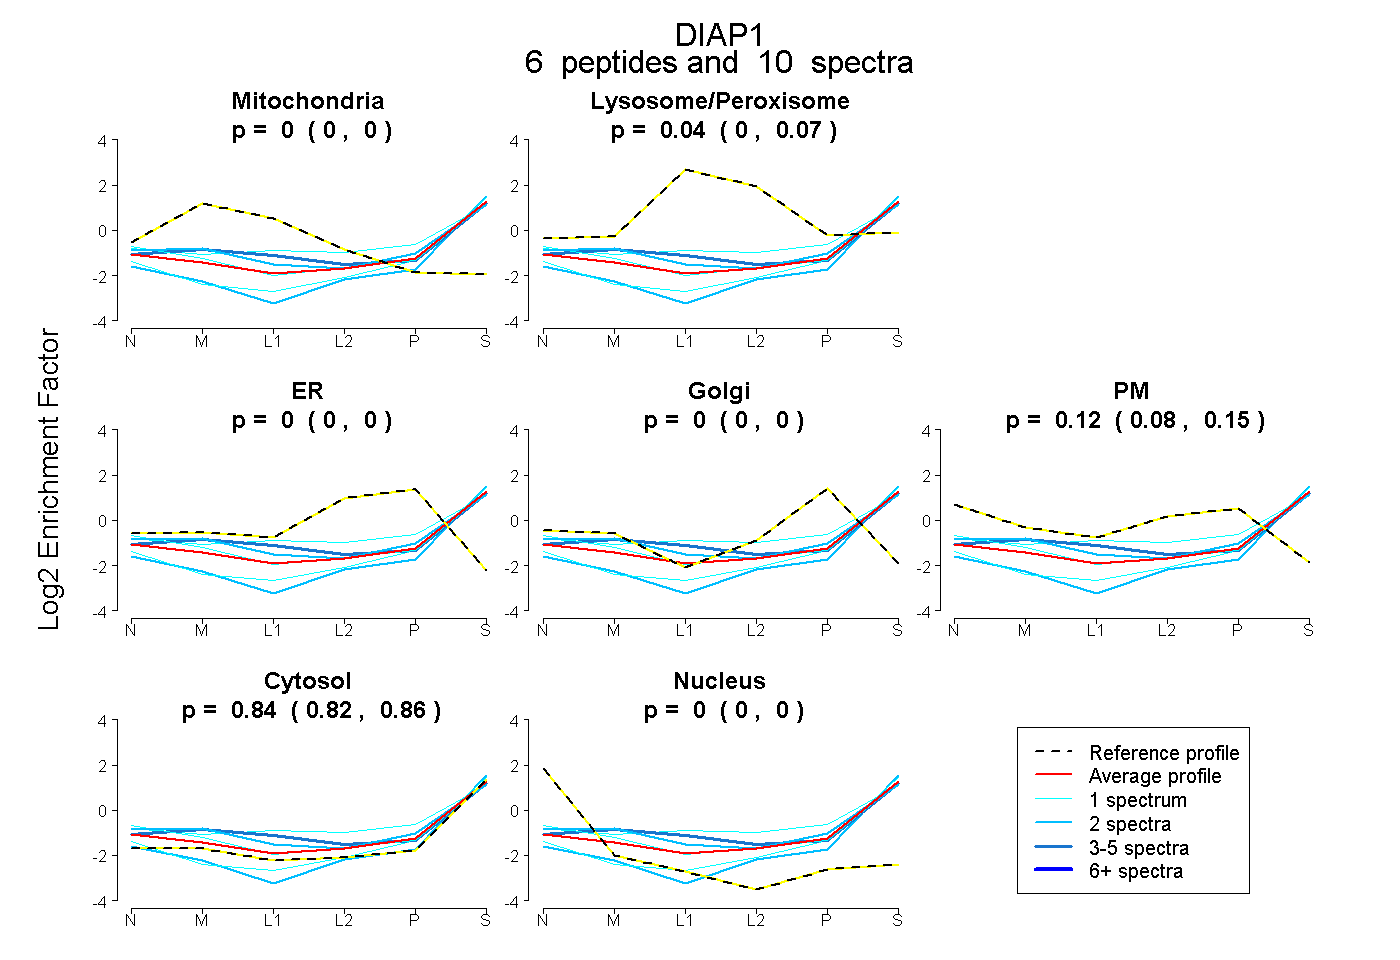 |
0.000
0.000 | 0.000 |
|
0.038
0.000 | 0.072 |
|
0.000
0.000 | 0.000 |
0.000
0.000 | 0.003 |
0.119
0.080 | 0.147 |
0.843
0.824 | 0.860 |
0.000
0.000 | 0.000 |
|
| | | Plot |
|
Lyso |
|
|
|
|
|
|
|
Other |
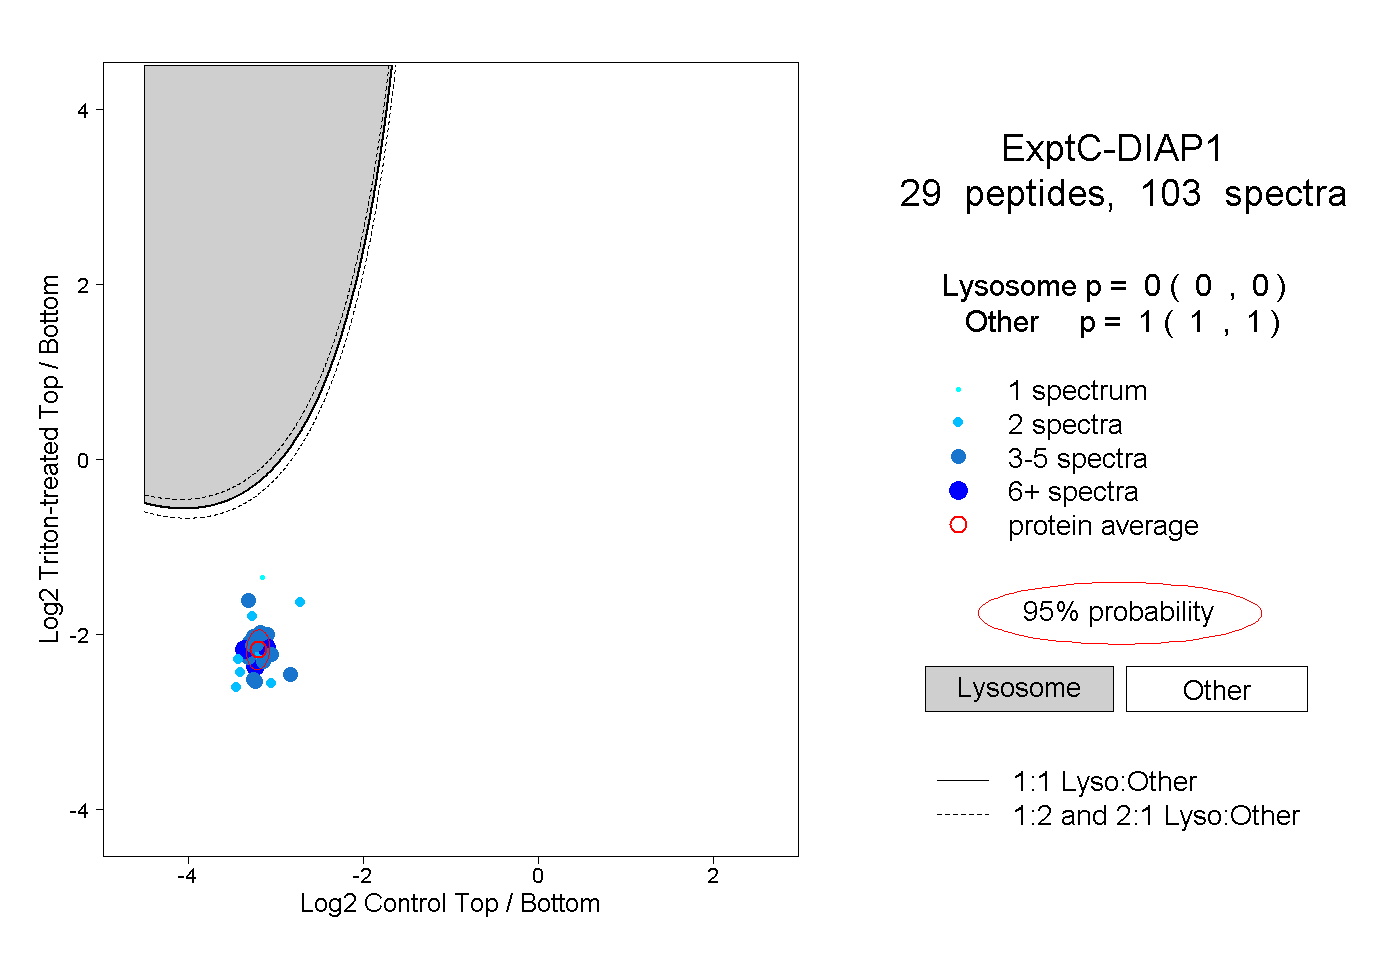
| Expt C |
29
peptides |
103
spectra |
 |
|
0.000
0.000 | 0.000 |
|
|
|
|
|
|
|
1.000
1.000 | 1.000 |
| 1 spectrum, NMFLQAVK |
|
0.000 |
|
|
|
|
|
|
|
1.000 |
| 2 spectra, FENNELFAK |
|
0.000 |
|
|
|
|
|
|
|
1.000 |
| 5 spectra, AFMNNK |
|
0.000 |
|
|
|
|
|
|
|
1.000 |
| 2 spectra, EIDNDDMR |
|
0.000 |
|
|
|
|
|
|
|
1.000 |
| 2 spectra, NGTDPDFK |
|
0.000 |
|
|
|
|
|
|
|
1.000 |
| 5 spectra, DDAVAASSAK |
|
0.000 |
|
|
|
|
|
|
|
1.000 |
| 2 spectra, LIEECVSQIVLHK |
|
0.000 |
|
|
|
|
|
|
|
1.000 |
| 5 spectra, HELQVEMK |
|
0.000 |
|
|
|
|
|
|
|
1.000 |
| 7 spectra, FPDELAHVEK |
|
0.000 |
|
|
|
|
|
|
|
1.000 |
| 4 spectra, LGLHQVLQELR |
|
0.000 |
|
|
|
|
|
|
|
1.000 |
| 3 spectra, LTGEVAK |
|
0.000 |
|
|
|
|
|
|
|
1.000 |
| 3 spectra, MPYQEIK |
|
0.000 |
|
|
|
|
|
|
|
1.000 |
| 3 spectra, NDYEARPQYYK |
|
0.000 |
|
|
|
|
|
|
|
1.000 |
| 6 spectra, ATELEK |
|
0.000 |
|
|
|
|
|
|
|
1.000 |
| 5 spectra, AEMEEVER |
|
0.000 |
|
|
|
|
|
|
|
1.000 |
| 2 spectra, VLEAMTER |
|
0.000 |
|
|
|
|
|
|
|
1.000 |
| 4 spectra, SGTSIALK |
|
0.000 |
|
|
|
|
|
|
|
1.000 |
| 3 spectra, QQITTQK |
|
0.000 |
|
|
|
|
|
|
|
1.000 |
| 2 spectra, DQEGGEEK |
|
0.000 |
|
|
|
|
|
|
|
1.000 |
| 2 spectra, VSAENLQK |
|
0.000 |
|
|
|
|
|
|
|
1.000 |
| 2 spectra, AGMNQK |
|
0.000 |
|
|
|
|
|
|
|
1.000 |
| 3 spectra, NQHEIIR |
|
0.000 |
|
|
|
|
|
|
|
1.000 |
| 2 spectra, DALDSEK |
|
0.000 |
|
|
|
|
|
|
|
1.000 |
| 5 spectra, DAQEQYNK |
|
0.000 |
|
|
|
|
|
|
|
1.000 |
| 3 spectra, QIADVER |
|
0.000 |
|
|
|
|
|
|
|
1.000 |
| 6 spectra, QDLEAEVSK |
|
0.000 |
|
|
|
|
|
|
|
1.000 |
| 8 spectra, LNAILFK |
|
0.000 |
|
|
|
|
|
|
|
1.000 |
| 4 spectra, QMPEPEQLK |
|
0.000 |
|
|
|
|
|
|
|
1.000 |
| 2 spectra, FQPLLDGLK |
|
0.000 |
|
|
|
|
|
|
|
1.000 |
| | | Plot |
|
Lyso |
|
|
|
|
|
|
|
Other |
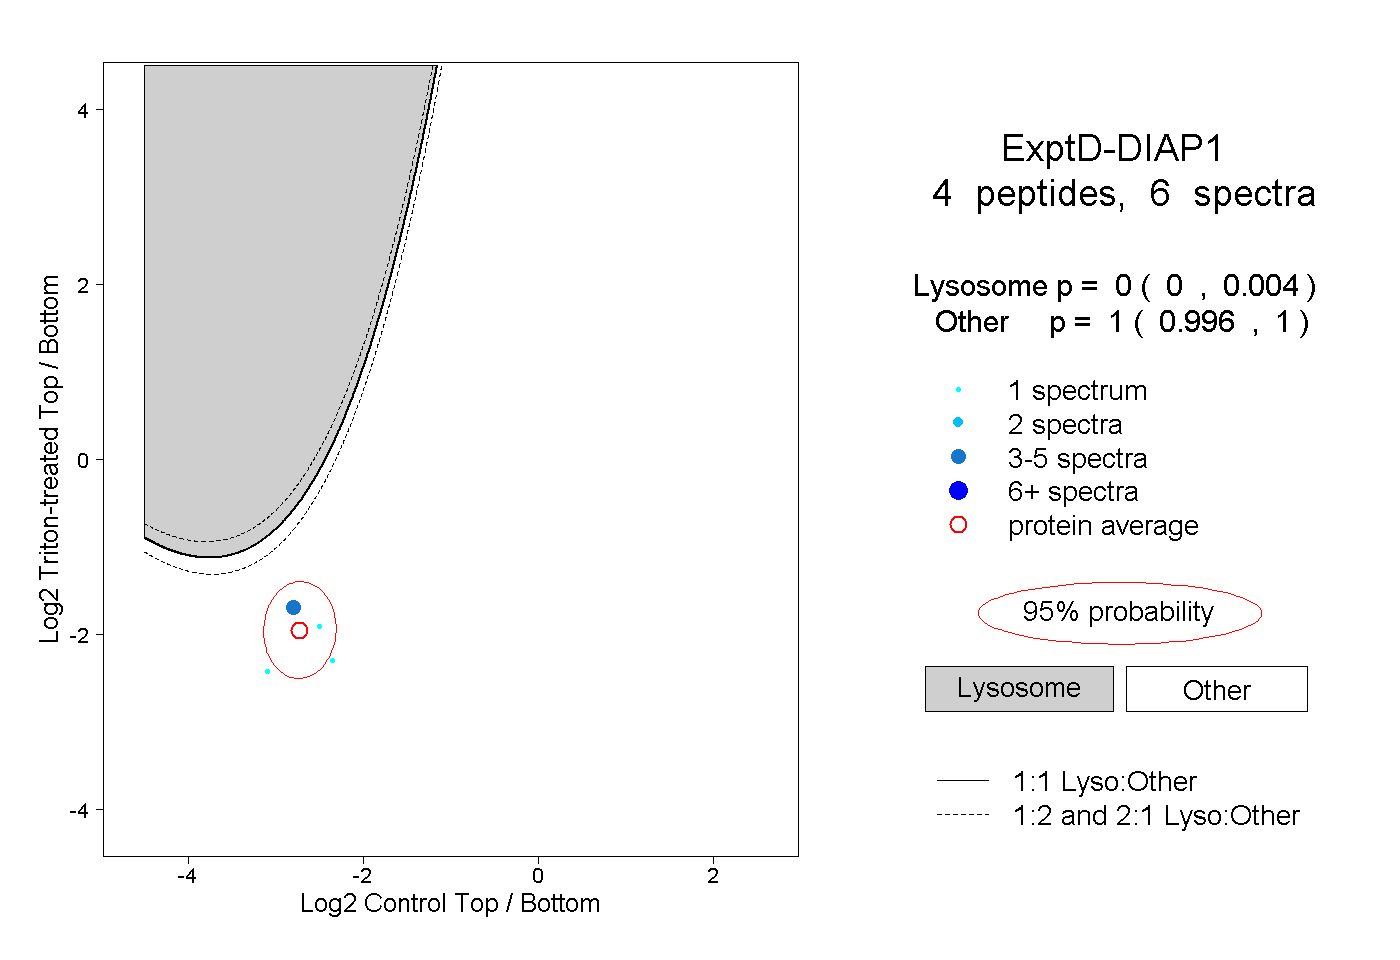
| Expt D |
4
peptides |
6
spectra |
 |
|
0.000
0.000 | 0.004 |
|
|
|
|
|
|
|
1.000
0.996 | 1.000 |