28
28peptides
spectra
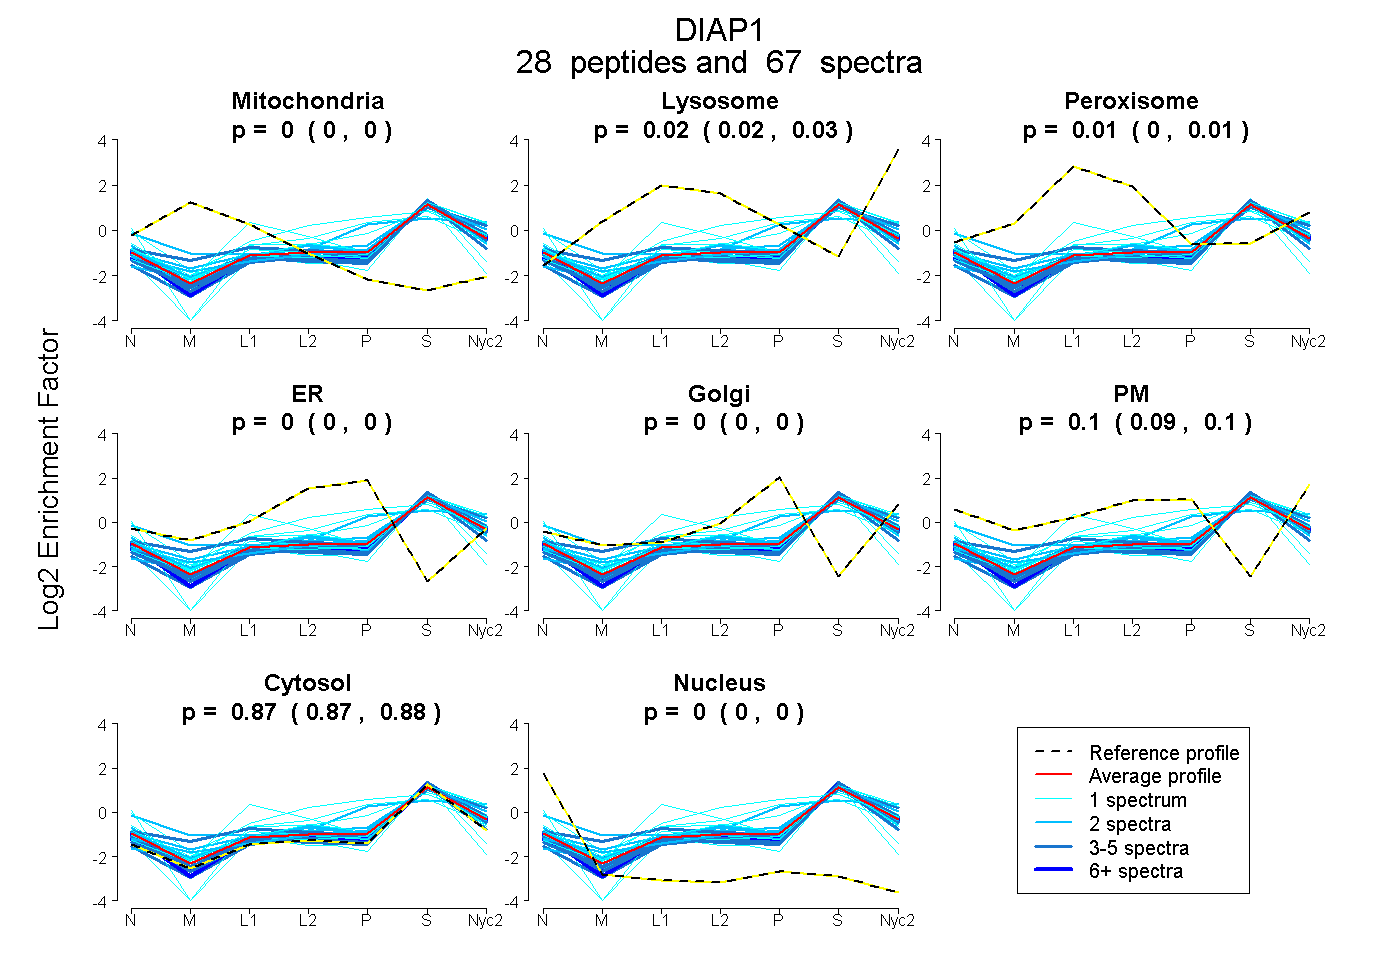
0.000 | 0.000
0.016 | 0.028
0.002 | 0.013
0.000 | 0.000
0.000 | 0.000
0.091 | 0.100
0.871 | 0.876
0.000 | 0.000
6peptides
spectra
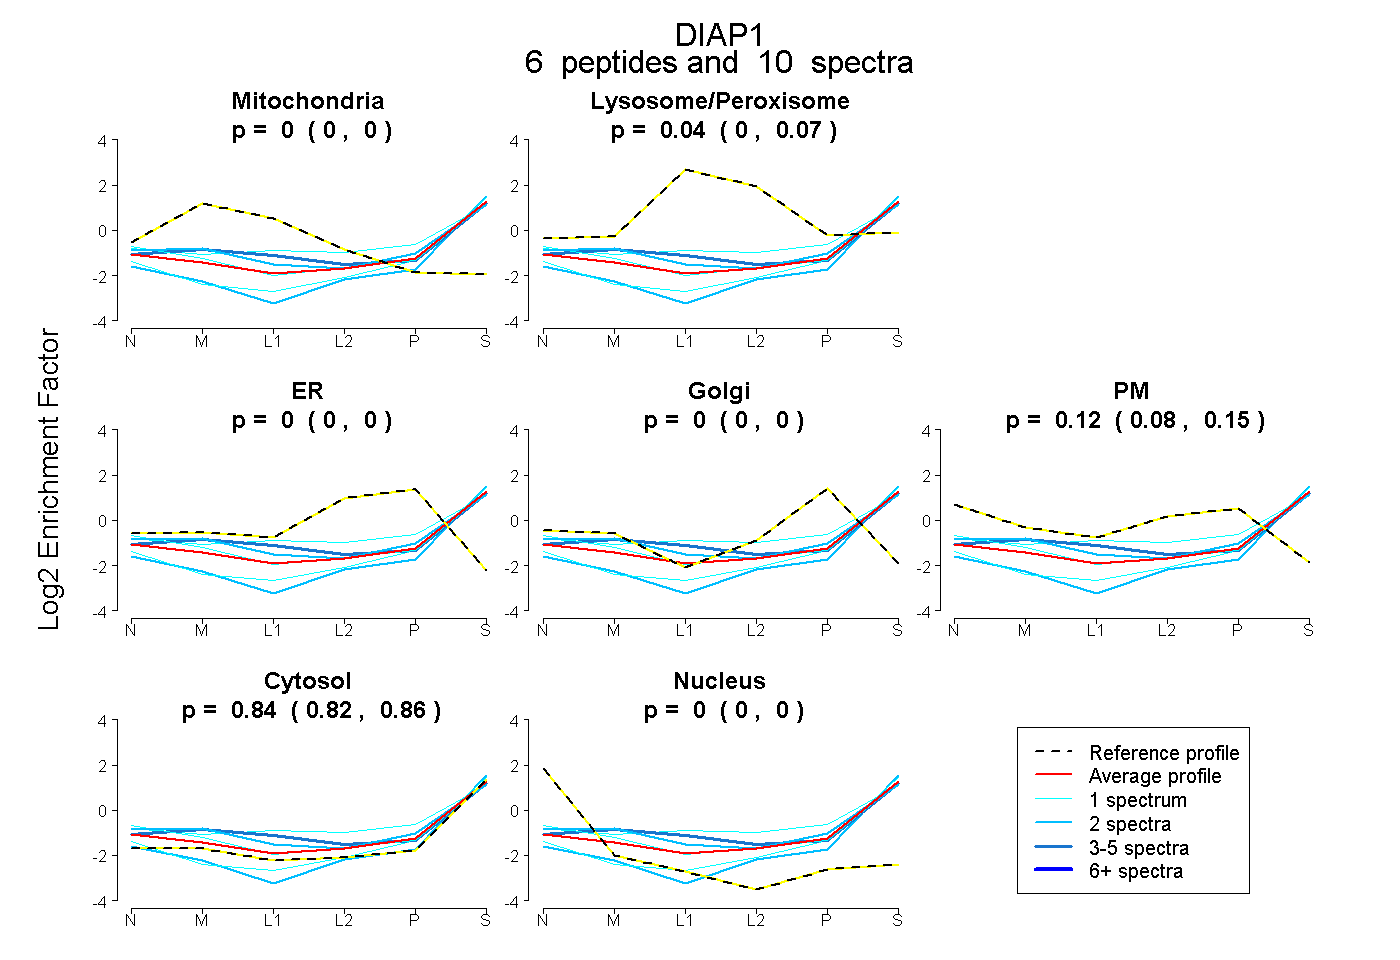
0.000 | 0.000
0.000 | 0.072
0.000 | 0.000
0.000 | 0.003
0.080 | 0.147
0.824 | 0.860
0.000 | 0.000