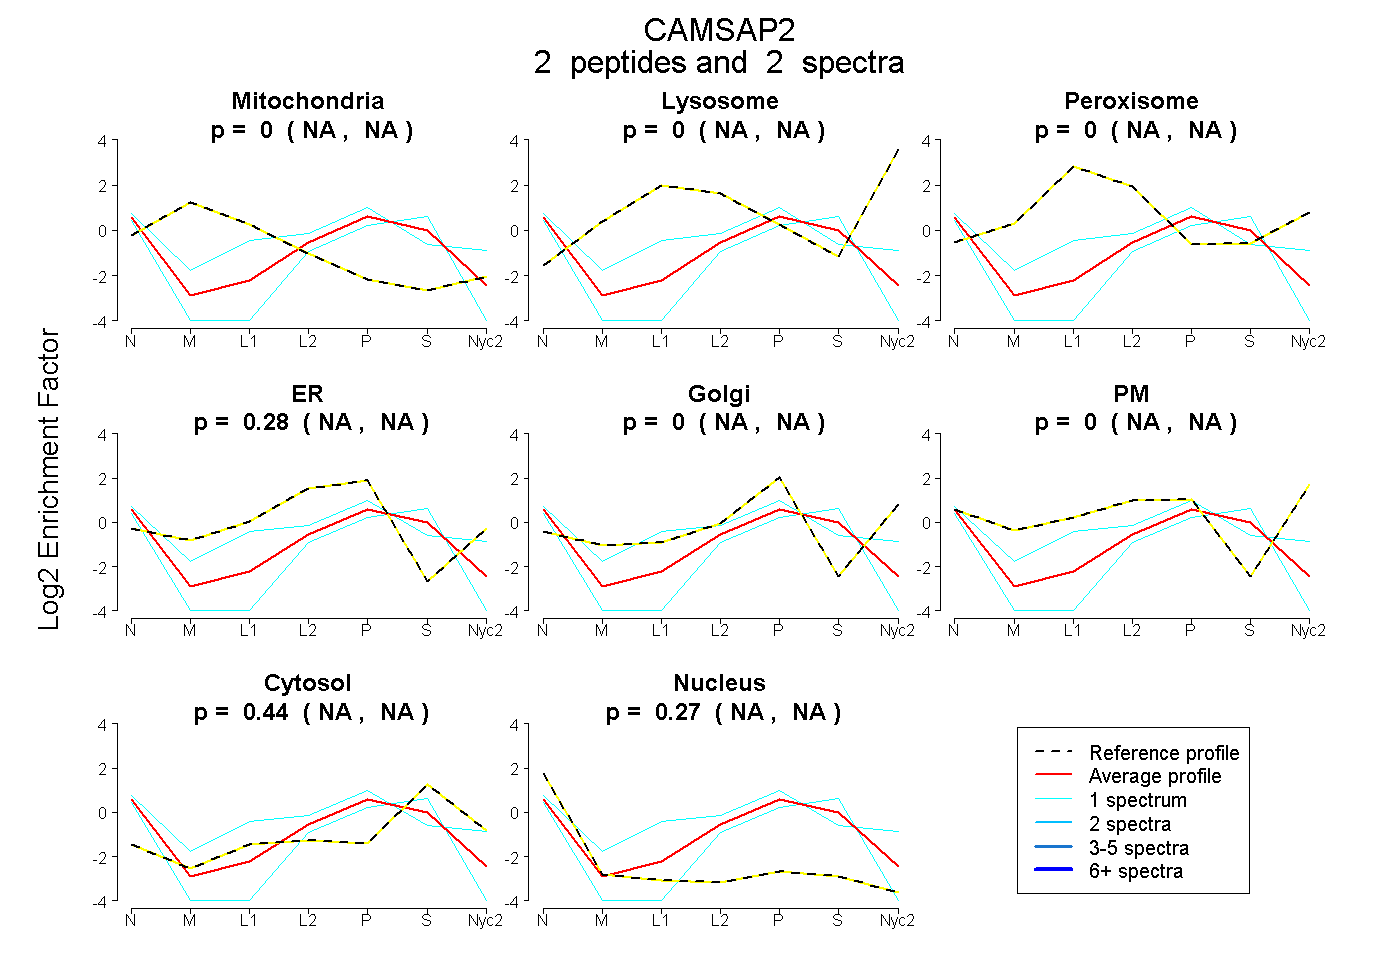
 2
2peptides
spectra
NA | NA
NA | NA
NA | NA
NA | NA
NA | NA
NA | NA
NA | NA
NA | NA
| Plot | Mito | Lyso | Perox | ER | Golgi | PM | Cytosol | Nucleus | |||||
| Expt A |
2 peptides |
2 spectra |
|
0.000 NA | NA |
0.000 NA | NA |
0.000 NA | NA |
0.282 NA | NA |
0.000 NA | NA |
0.000 NA | NA |
0.443 NA | NA |
0.275 NA | NA |
| 1 spectrum, SQPGSSASSSSGVK | 0.000 | 0.000 | 0.000 | 0.461 | 0.000 | 0.107 | 0.326 | 0.106 | ||
| 1 spectrum, QLPCIPLVENLLK | 0.000 | 0.000 | 0.000 | 0.001 | 0.000 | 0.000 | 0.551 | 0.448 |
| Plot | Lyso | Other | |||||||||||
| Expt C |
1 peptide |
1 spectrum |
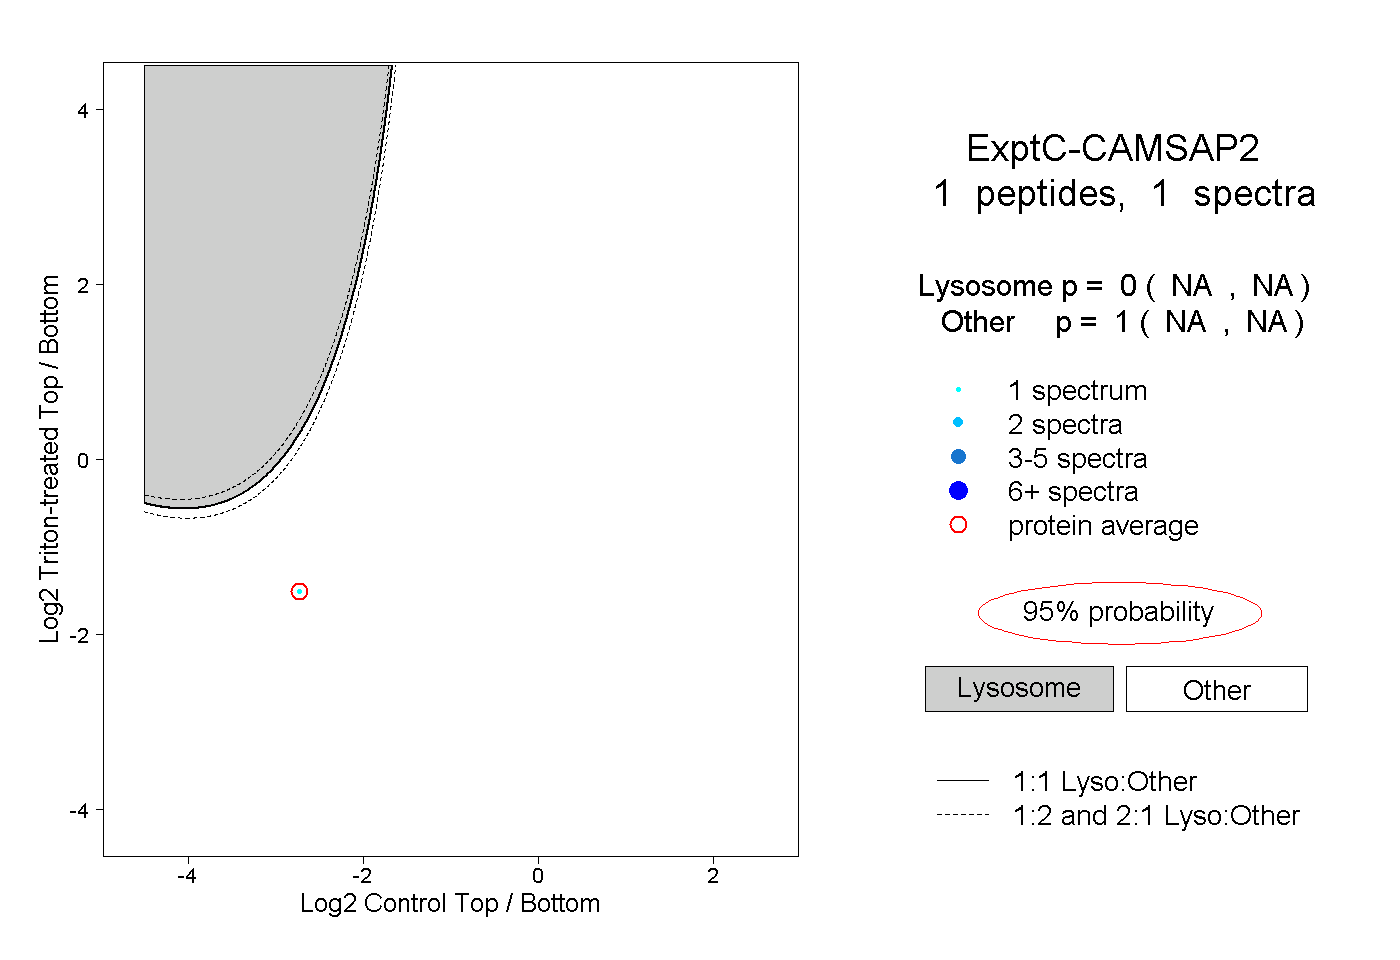 |
0.000 NA | NA |
1.000 NA | NA |