 1
1peptide
spectra
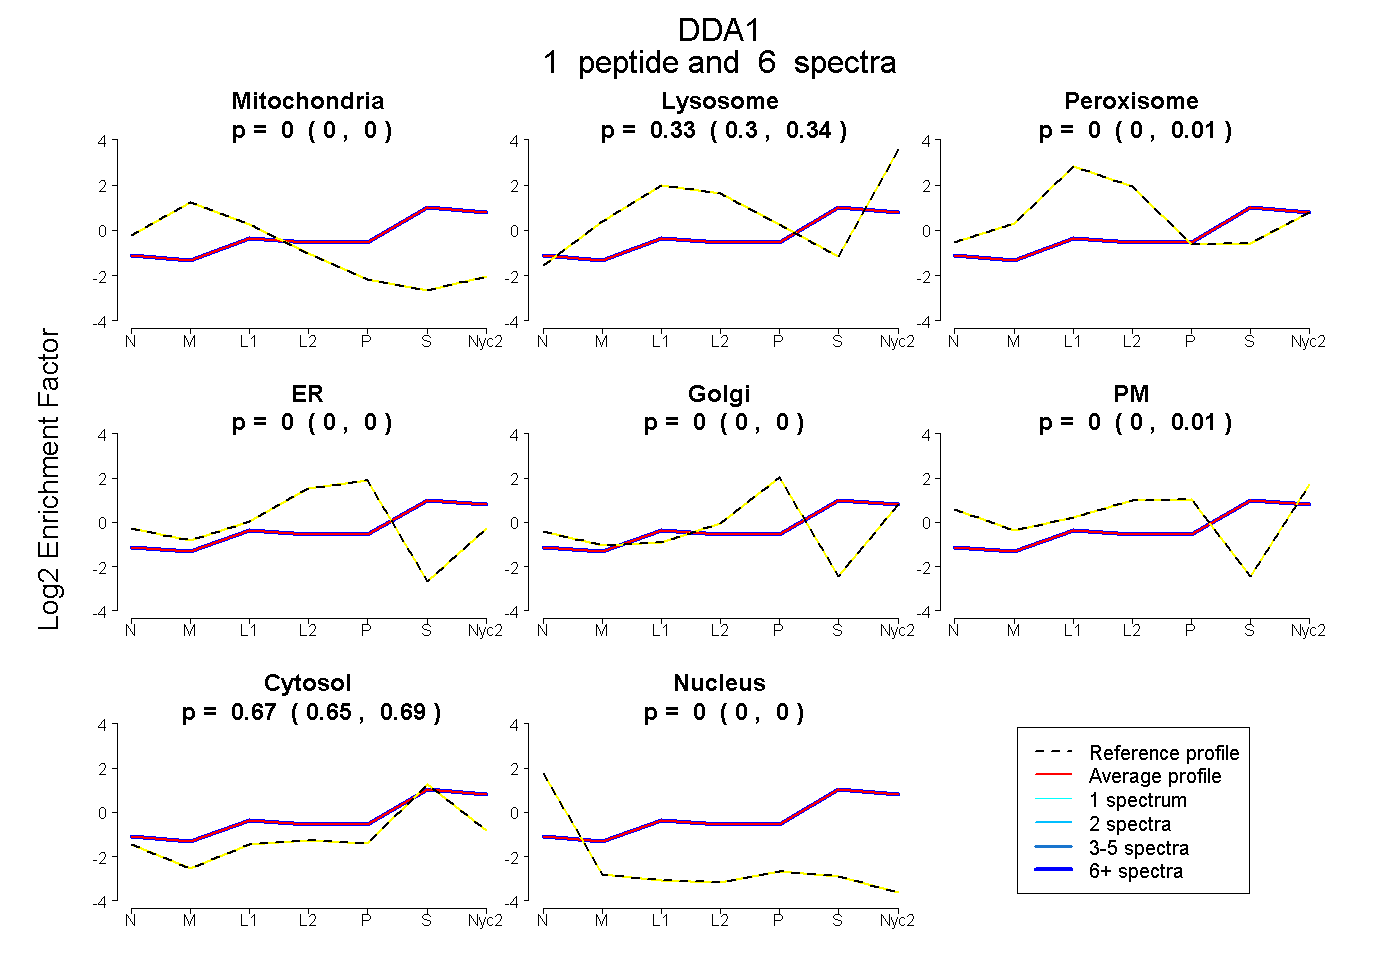
0.000 | 0.000
0.299 | 0.343
0.000 | 0.006
0.000 | 0.000
0.000 | 0.004
0.000 | 0.013
0.651 | 0.689
0.000 | 0.000
1peptide
spectrum
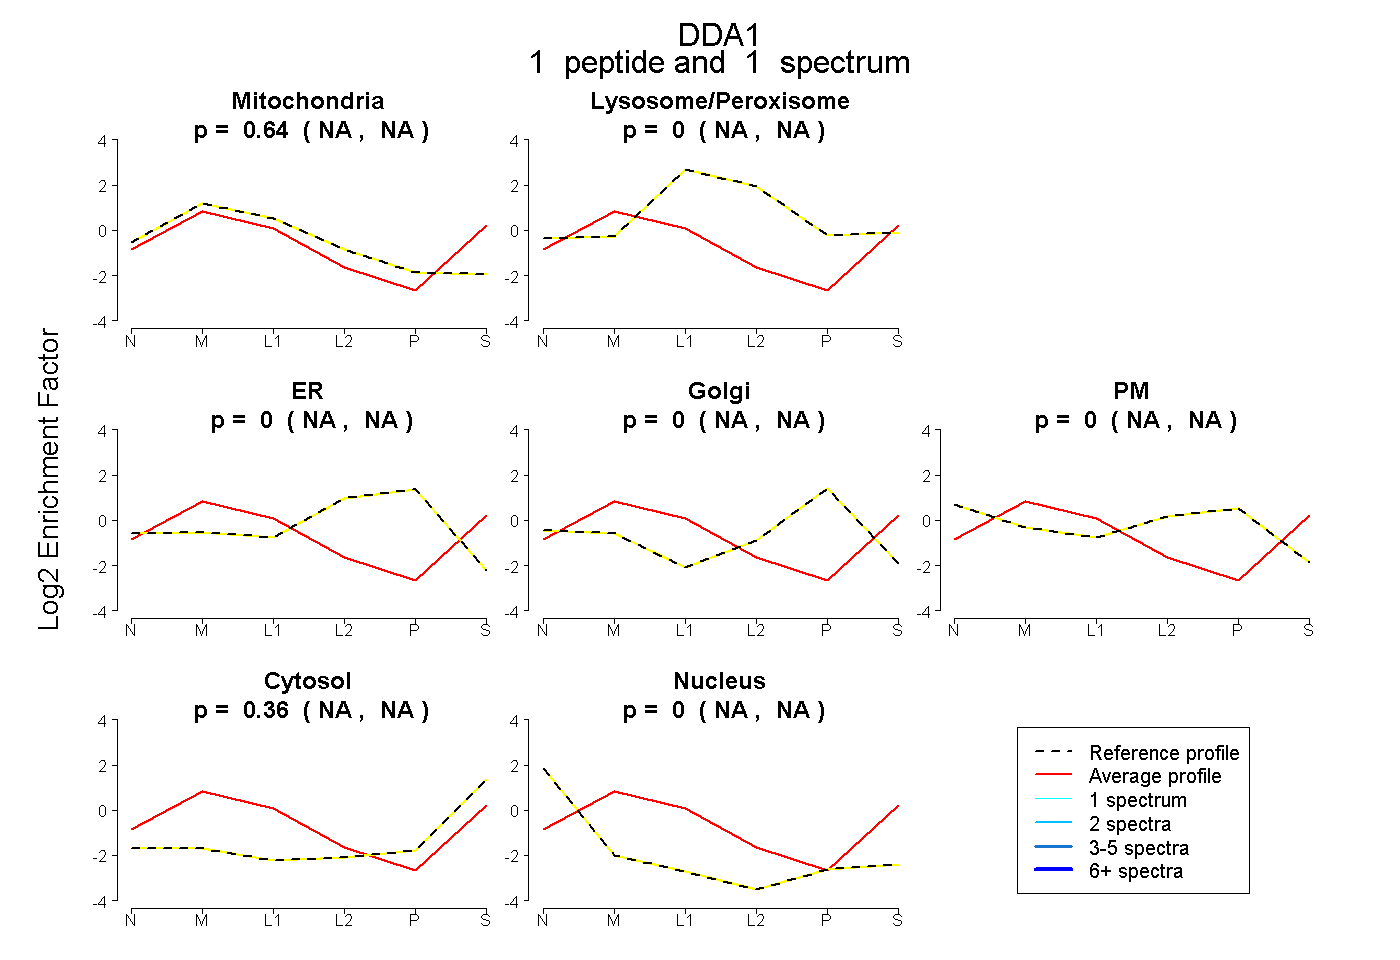
NA | NA
NA | NA
NA | NA
NA | NA
NA | NA
NA | NA
NA | NA
2peptides
spectra
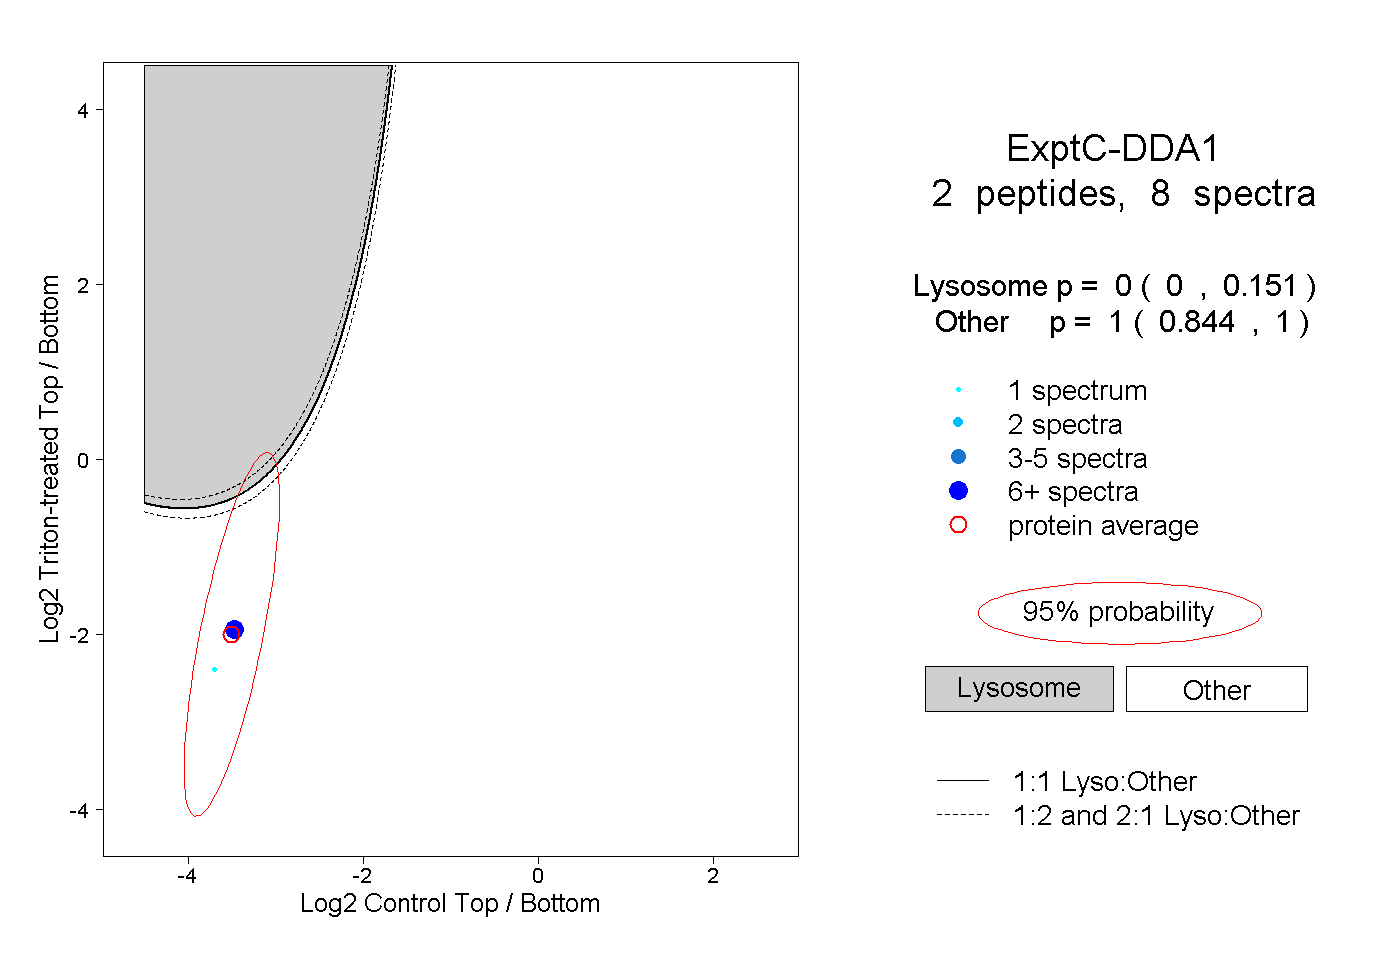
0.000 | 0.151
0.844 | 1.000