 2
2peptides
spectra
0.176 | 0.463
0.000 | 0.005
0.015 | 0.337
0.000 | 0.327
0.000 | 0.275
0.000 | 0.177
0.127 | 0.224
0.000 | 0.000
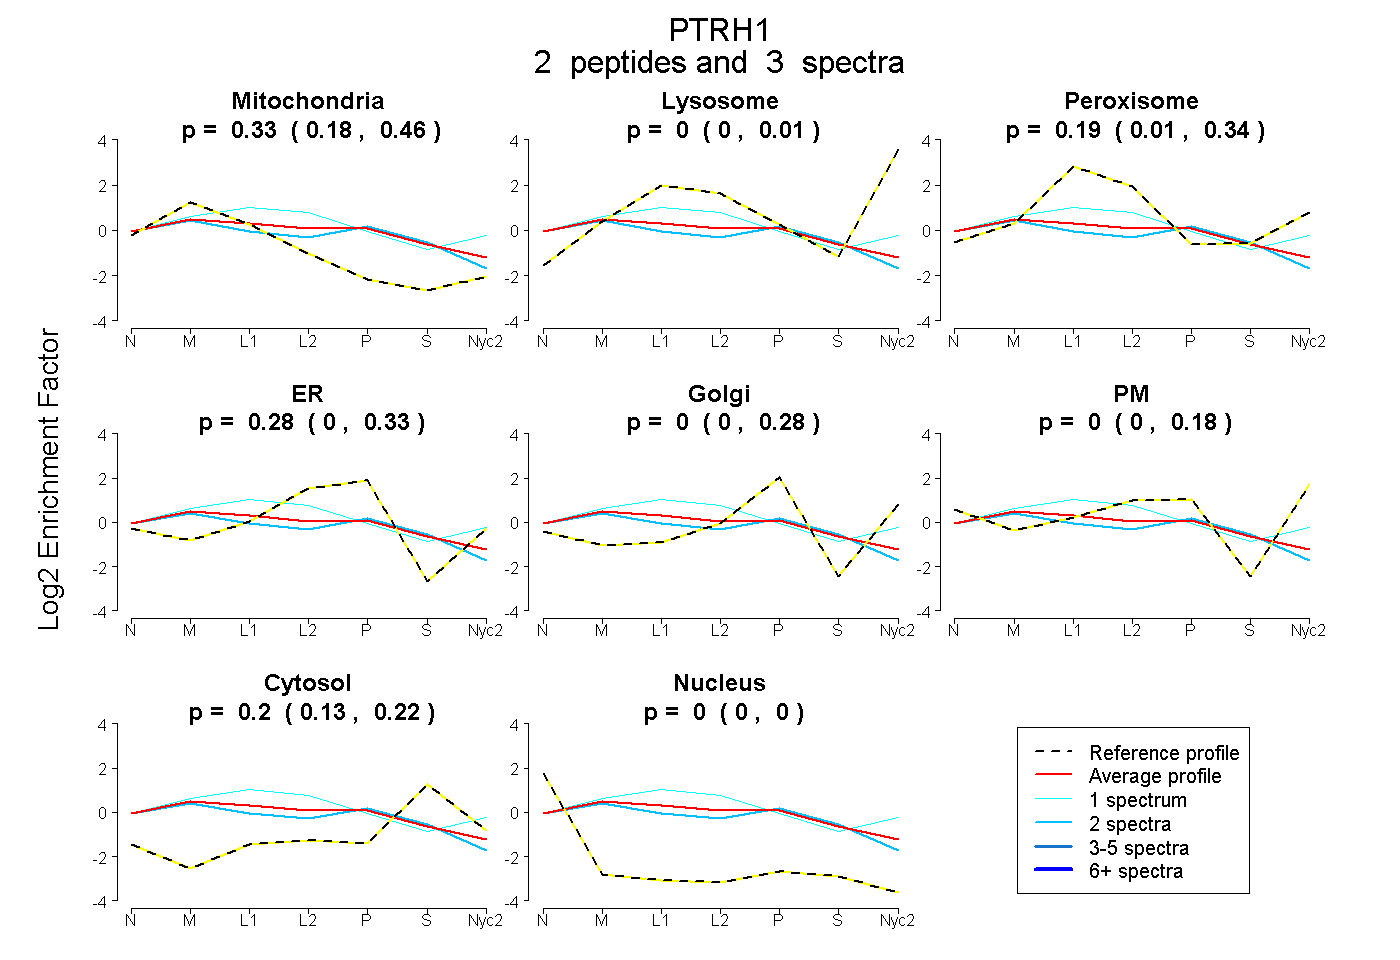
| Plot | Mito | Lyso | Perox | ER | Golgi | PM | Cytosol | Nucleus | |||||
| Expt A |
2 peptides |
3 spectra |
|
0.328 0.176 | 0.463 |
0.000 0.000 | 0.005 |
0.195 0.015 | 0.337 |
0.279 0.000 | 0.327 |
0.000 0.000 | 0.275 |
0.000 0.000 | 0.177 |
0.198 0.127 | 0.224 |
0.000 0.000 | 0.000 |