 4
4peptides
spectra
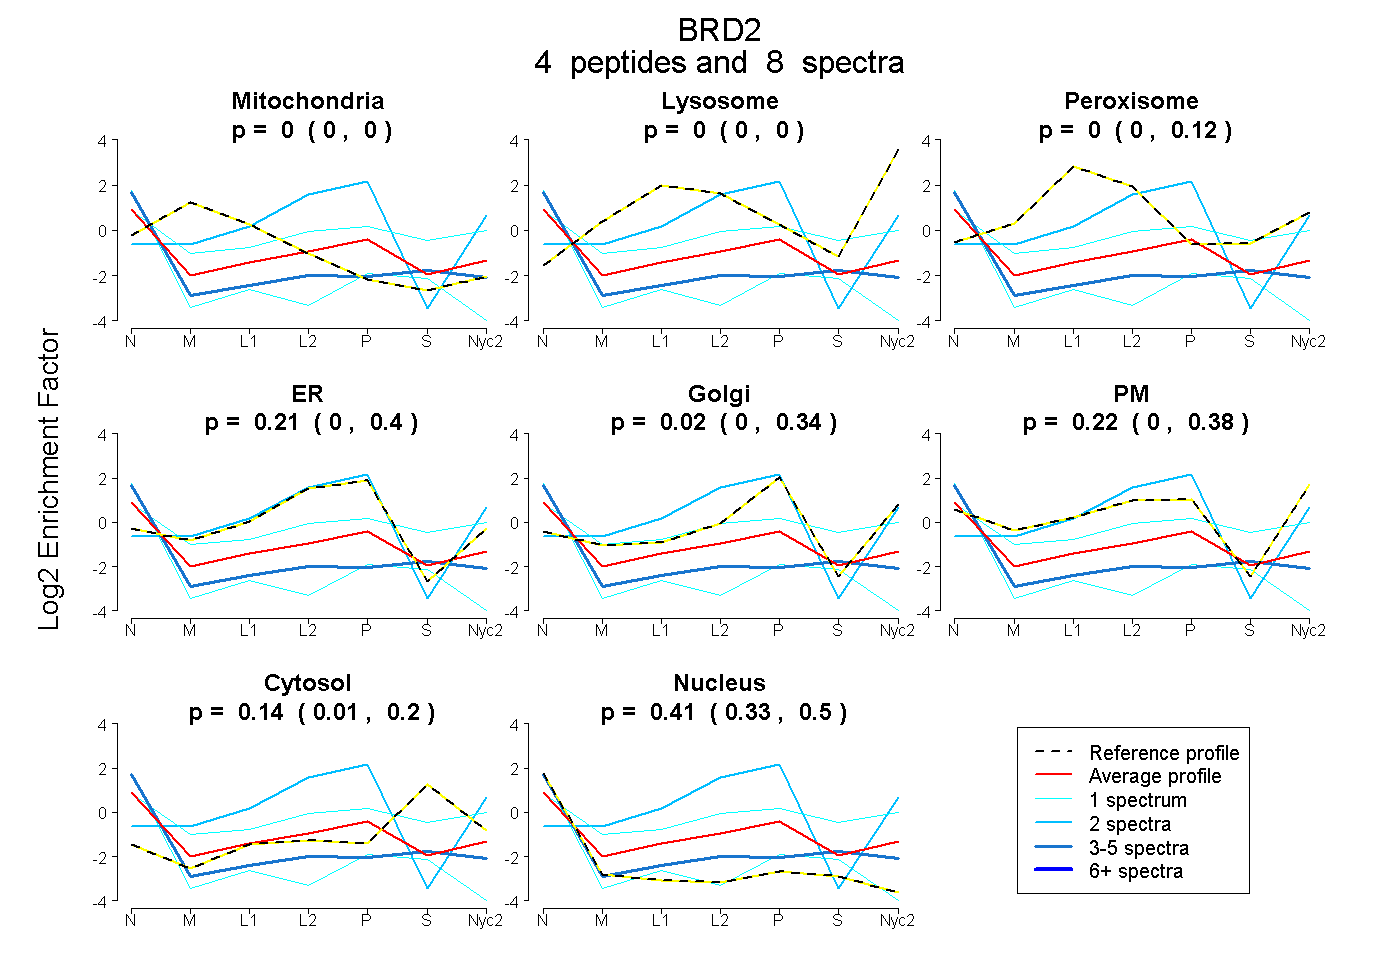
0.000 | 0.000
0.000 | 0.000
0.000 | 0.118
0.000 | 0.401
0.000 | 0.344
0.000 | 0.381
0.009 | 0.199
0.334 | 0.500
| Plot | Mito | Lyso | Perox | ER | Golgi | PM | Cytosol | Nucleus | |||||
| Expt A |
4 peptides |
8 spectra |
|
0.000 0.000 | 0.000 |
0.000 0.000 | 0.000 |
0.000 0.000 | 0.118 |
0.206 0.000 | 0.401 |
0.022 0.000 | 0.344 |
0.217 0.000 | 0.381 |
0.141 0.009 | 0.199 |
0.414 0.334 | 0.500 |
| 2 spectra, EELALEK | 0.000 | 0.089 | 0.000 | 0.788 | 0.085 | 0.038 | 0.000 | 0.000 | ||
| 1 spectrum, HPMDLSTVK | 0.000 | 0.000 | 0.026 | 0.000 | 0.000 | 0.533 | 0.339 | 0.101 | ||
| 4 spectra, VVHIIQAR | 0.000 | 0.000 | 0.000 | 0.000 | 0.000 | 0.139 | 0.183 | 0.679 | ||
| 1 spectrum, DSNPEEIEIDFETLKPSTLR | 0.000 | 0.000 | 0.000 | 0.000 | 0.000 | 0.000 | 0.080 | 0.920 |
| Plot | Mito | Lyso or Perox | ER | Golgi | PM | Cytosol | Nucleus | ||||||
| Expt B |
1 peptide |
1 spectrum |
 |
0.015 NA | NA |
0.048 NA | NA |
0.000 NA | NA |
0.019 NA | NA |
0.119 NA | NA |
0.002 NA | NA |
0.796 NA | NA |
|||
| Plot | Lyso | Other | |||||||||||
| Expt C |
1 peptide |
1 spectrum |
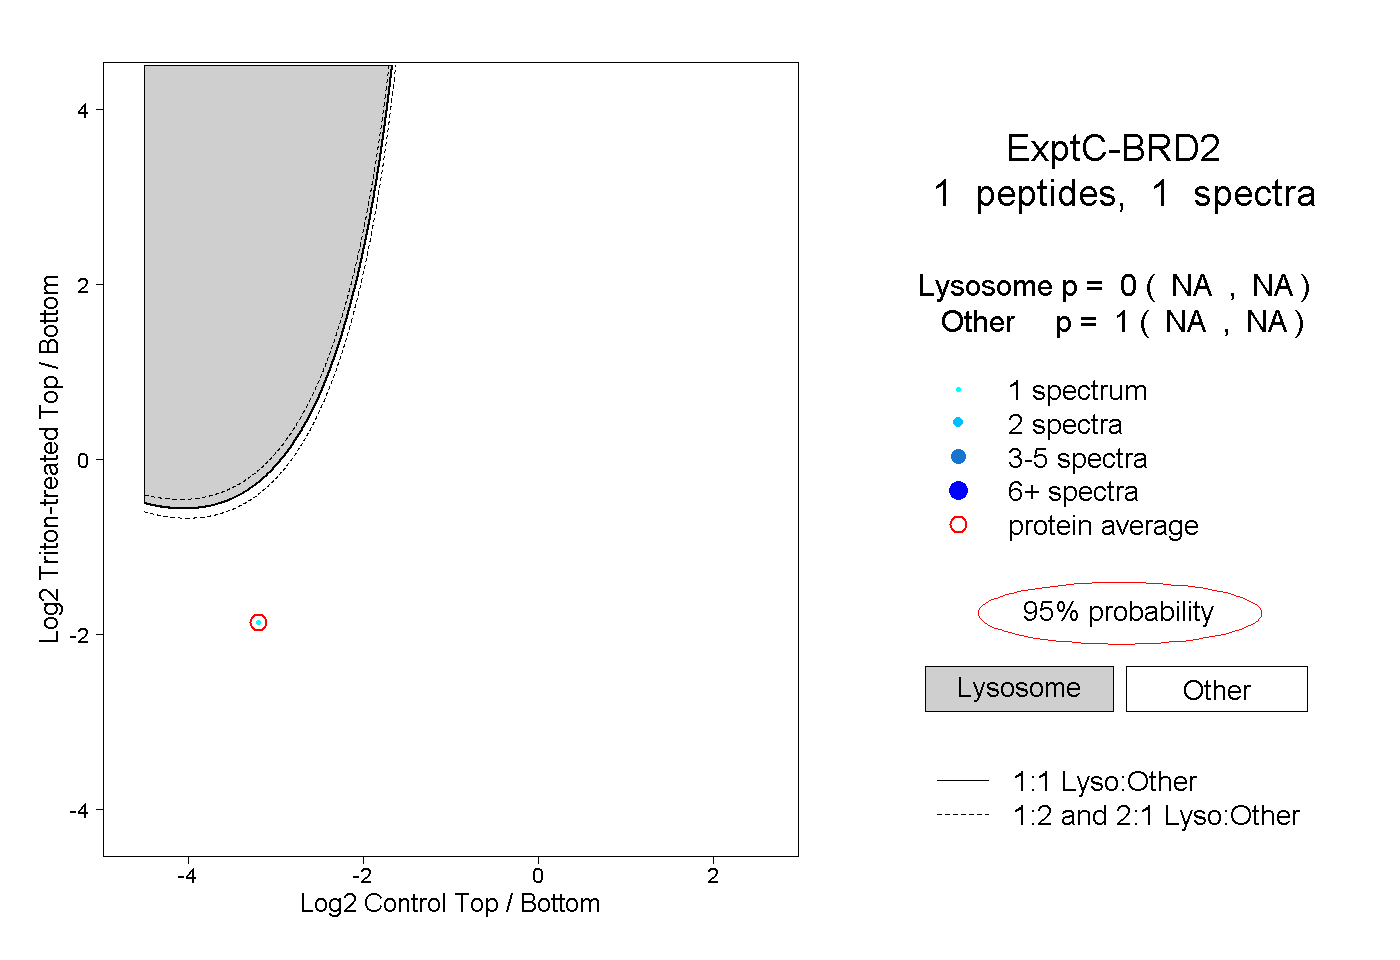 |
0.000 NA | NA |
1.000 NA | NA |