 1
1peptide
spectra
0.000 | 0.004
0.000 | 0.000
0.000 | 0.011
0.000 | 0.012
0.103 | 0.205
0.292 | 0.393
0.463 | 0.506
0.000 | 0.009
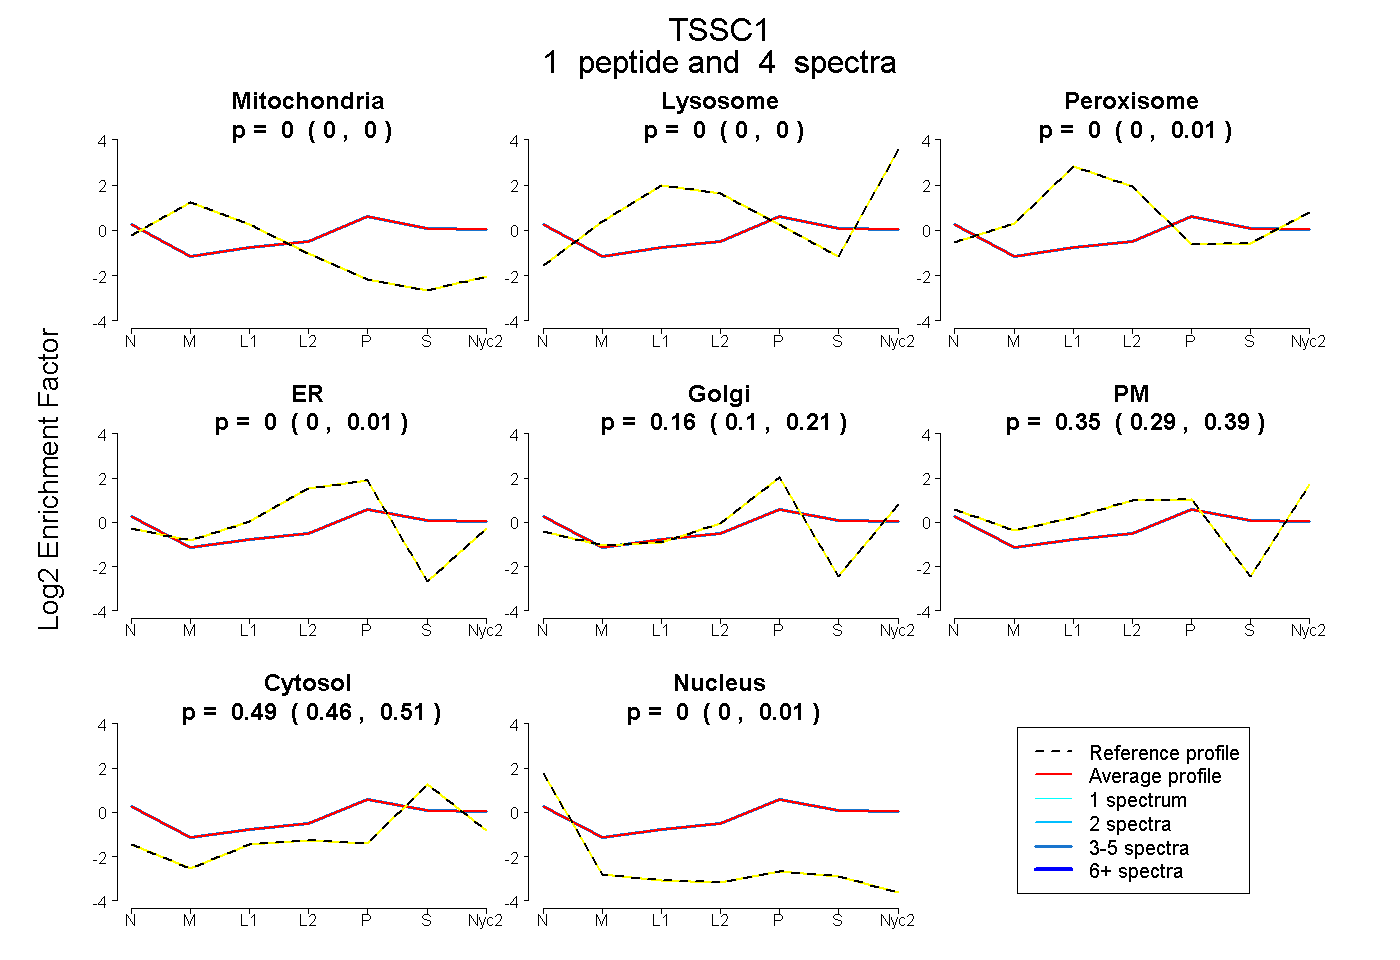
| Plot | Mito | Lyso | Perox | ER | Golgi | PM | Cytosol | Nucleus | |||||
| Expt A |
1 peptide |
4 spectra |
|
0.000 0.000 | 0.004 |
0.000 0.000 | 0.000 |
0.000 0.000 | 0.011 |
0.000 0.000 | 0.012 |
0.158 0.103 | 0.205 |
0.352 0.292 | 0.393 |
0.490 0.463 | 0.506 |
0.000 0.000 | 0.009 |