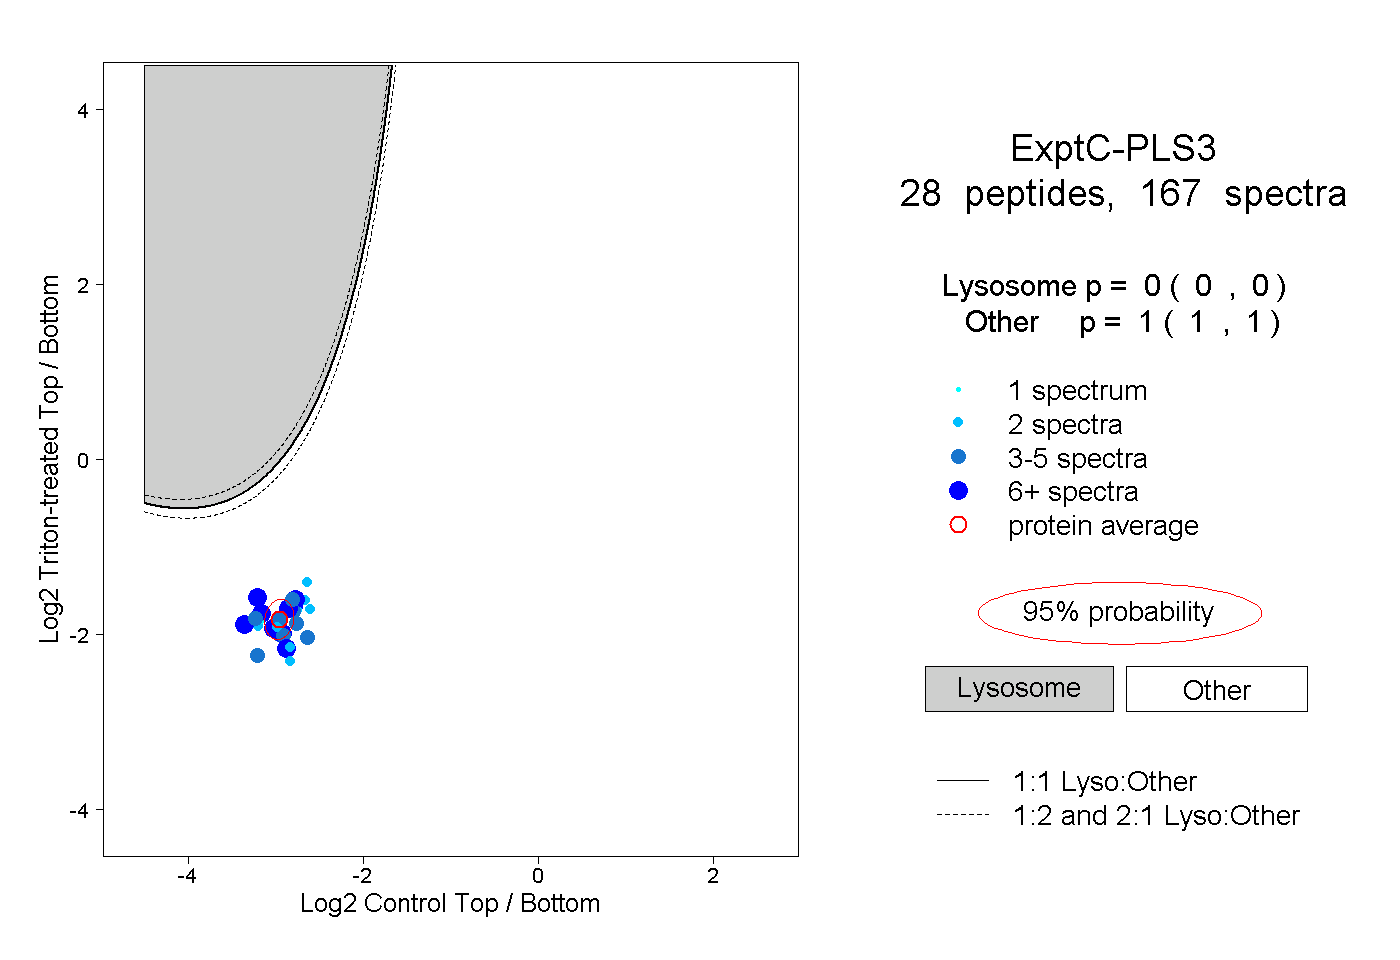
28
28peptides
spectra
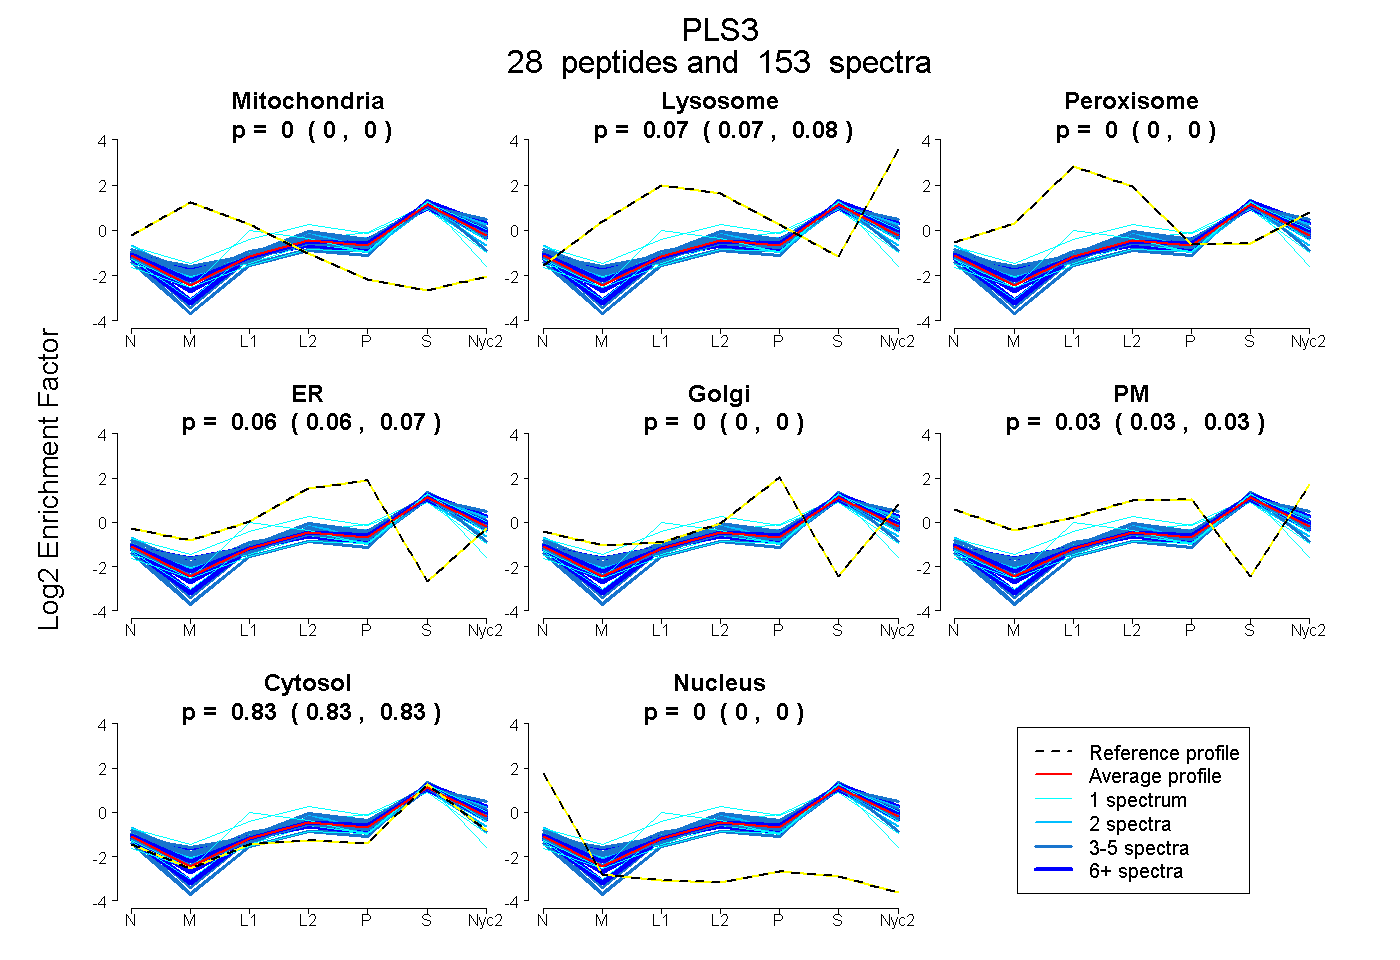
0.000 | 0.000
0.073 | 0.076
0.000 | 0.000
0.062 | 0.068
0.000 | 0.000
0.026 | 0.032
0.830 | 0.832
0.000 | 0.000
12peptides
spectra
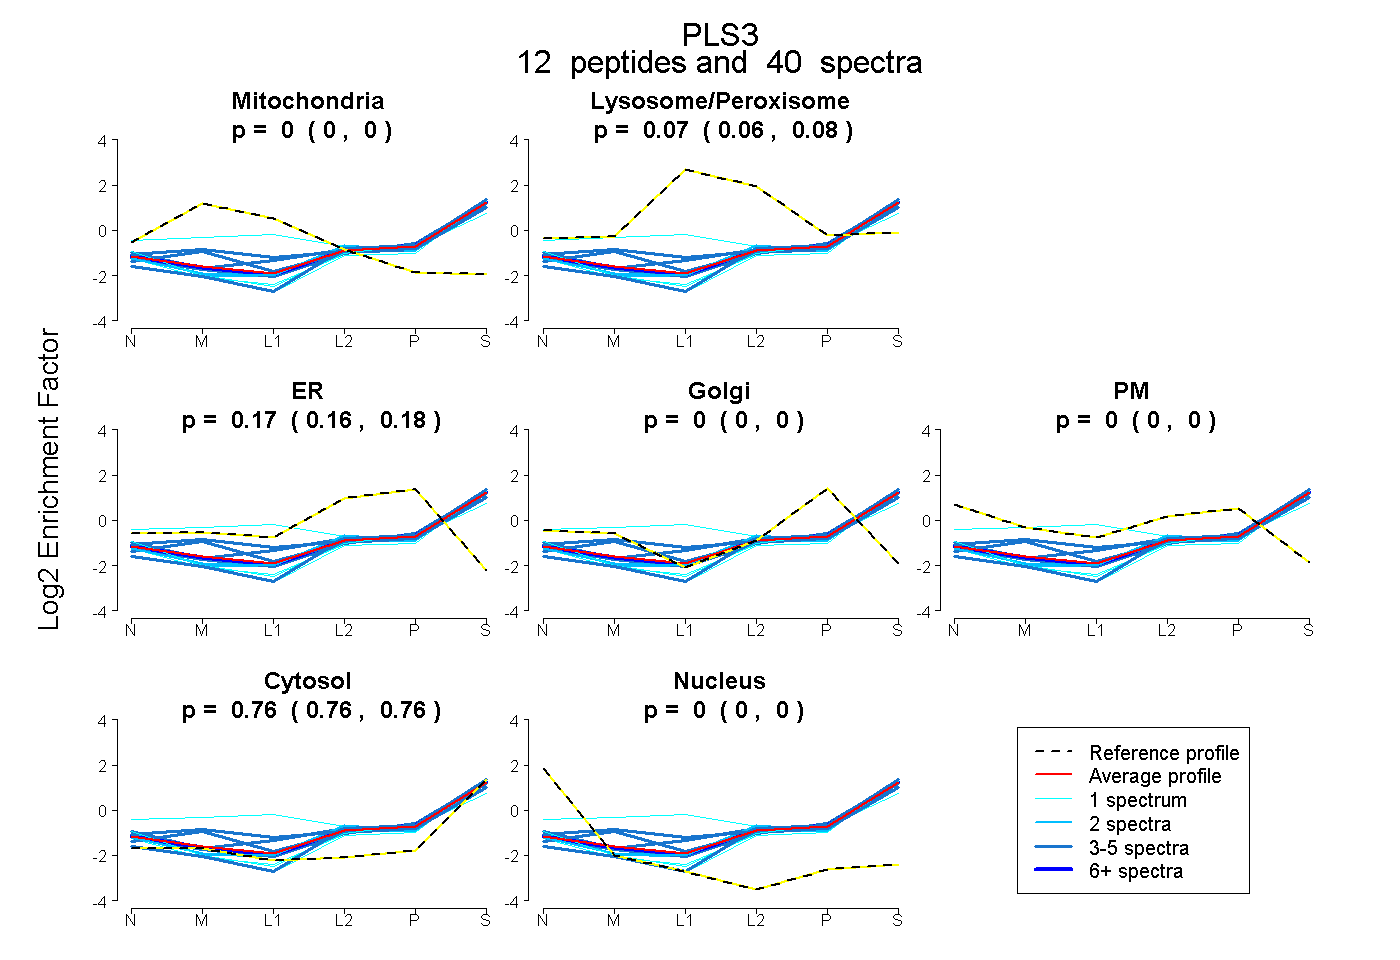
0.000 | 0.000
0.058 | 0.078
0.164 | 0.178
0.000 | 0.000
0.000 | 0.000
0.756 | 0.764
0.000 | 0.000