 28
28peptides
spectra
0.000 | 0.000
0.073 | 0.076
0.000 | 0.000
0.062 | 0.068
0.000 | 0.000
0.026 | 0.032
0.830 | 0.832
0.000 | 0.000
| Plot | Mito | Lyso | Perox | ER | Golgi | PM | Cytosol | Nucleus | |||||
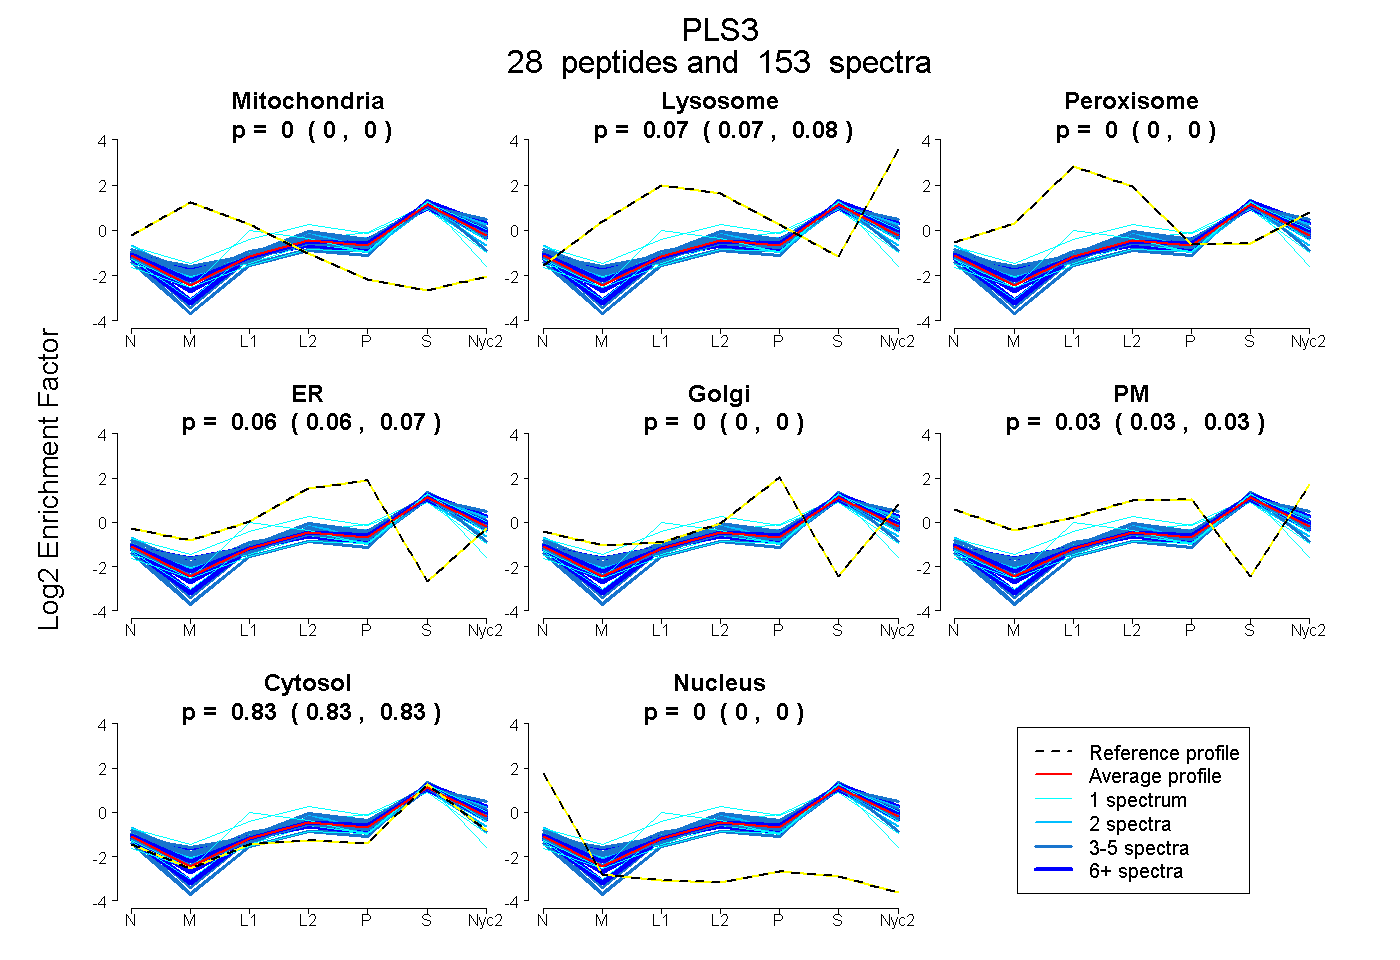
| Expt A |
28 peptides |
153 spectra |
|
0.000 0.000 | 0.000 |
0.075 0.073 | 0.076 |
0.000 0.000 | 0.000 |
0.065 0.062 | 0.068 |
0.000 0.000 | 0.000 |
0.029 0.026 | 0.032 |
0.831 0.830 | 0.832 |
0.000 0.000 | 0.000 |
| 2 spectra, QFVTPADVVSGNPK | 0.000 | 0.036 | 0.078 | 0.049 | 0.000 | 0.013 | 0.824 | 0.000 | ||
| 6 spectra, LGANMK | 0.000 | 0.126 | 0.000 | 0.039 | 0.090 | 0.000 | 0.745 | 0.000 | ||
| 3 spectra, INNFSADIK | 0.000 | 0.057 | 0.000 | 0.000 | 0.000 | 0.186 | 0.757 | 0.000 | ||
| 26 spectra, DGETLEELMK | 0.000 | 0.050 | 0.000 | 0.085 | 0.000 | 0.037 | 0.829 | 0.000 | ||
| 1 spectrum, MVMTVFACLMGR | 0.000 | 0.000 | 0.189 | 0.190 | 0.000 | 0.000 | 0.621 | 0.000 | ||
| 1 spectrum, EANMPLPGYK | 0.000 | 0.000 | 0.000 | 0.177 | 0.000 | 0.000 | 0.823 | 0.000 | ||
| 3 spectra, ISFNEFVYIFQEVK | 0.000 | 0.000 | 0.000 | 0.022 | 0.000 | 0.000 | 0.978 | 0.000 | ||
| 10 spectra, AYFHLLNQIAPK | 0.000 | 0.109 | 0.000 | 0.083 | 0.010 | 0.000 | 0.798 | 0.000 | ||
| 2 spectra, ATDDIIVNWVNGTLSEAGK | 0.000 | 0.051 | 0.000 | 0.028 | 0.009 | 0.064 | 0.847 | 0.000 | ||
| 1 spectrum, VDLNSNGFICDYELHELFK | 0.000 | 0.000 | 0.000 | 0.070 | 0.000 | 0.000 | 0.930 | 0.000 | ||
| 5 spectra, HVIPMNPNTDDLFK | 0.000 | 0.000 | 0.114 | 0.000 | 0.000 | 0.086 | 0.799 | 0.000 | ||
| 18 spectra, YAVSMAR | 0.000 | 0.095 | 0.000 | 0.000 | 0.029 | 0.072 | 0.804 | 0.000 | ||
| 2 spectra, NEALAALLR | 0.000 | 0.124 | 0.000 | 0.000 | 0.000 | 0.090 | 0.786 | 0.000 | ||
| 4 spectra, LMLDGDR | 0.000 | 0.000 | 0.000 | 0.114 | 0.015 | 0.000 | 0.871 | 0.000 | ||
| 1 spectrum, YPALTKPENQDIDWTLLEGETR | 0.000 | 0.077 | 0.174 | 0.000 | 0.000 | 0.000 | 0.749 | 0.000 | ||
| 2 spectra, IENCNYAVELGK | 0.000 | 0.000 | 0.006 | 0.197 | 0.000 | 0.030 | 0.766 | 0.000 | ||
| 6 spectra, ALENDPDCR | 0.000 | 0.081 | 0.044 | 0.058 | 0.000 | 0.002 | 0.815 | 0.000 | ||
| 3 spectra, STSIQSFK | 0.000 | 0.080 | 0.000 | 0.059 | 0.000 | 0.064 | 0.798 | 0.000 | ||
| 1 spectrum, YTLNVMEDLGEGQK | 0.000 | 0.042 | 0.000 | 0.000 | 0.029 | 0.000 | 0.929 | 0.000 | ||
| 21 spectra, AESMLQQADK | 0.000 | 0.084 | 0.000 | 0.002 | 0.028 | 0.049 | 0.837 | 0.000 | ||
| 4 spectra, WANFHLENSGWQK | 0.000 | 0.165 | 0.000 | 0.100 | 0.000 | 0.003 | 0.731 | 0.000 | ||
| 5 spectra, IGLFADIELSR | 0.000 | 0.026 | 0.000 | 0.000 | 0.000 | 0.000 | 0.974 | 0.000 | ||
| 3 spectra, YAFVNWINK | 0.000 | 0.212 | 0.000 | 0.000 | 0.000 | 0.048 | 0.741 | 0.000 | ||
| 9 spectra, LSPEELLLR | 0.000 | 0.112 | 0.000 | 0.000 | 0.000 | 0.000 | 0.888 | 0.000 | ||
| 1 spectrum, MINLSVPDTIDER | 0.000 | 0.077 | 0.000 | 0.014 | 0.065 | 0.000 | 0.844 | 0.000 | ||
| 7 spectra, SSDIAK | 0.000 | 0.017 | 0.000 | 0.075 | 0.045 | 0.000 | 0.863 | 0.000 | ||
| 3 spectra, VPVDWSK | 0.000 | 0.074 | 0.000 | 0.063 | 0.000 | 0.000 | 0.863 | 0.000 | ||
| 3 spectra, VNKPPYPK | 0.000 | 0.087 | 0.000 | 0.103 | 0.000 | 0.049 | 0.761 | 0.000 |
| Plot | Mito | Lyso or Perox | ER | Golgi | PM | Cytosol | Nucleus | ||||||
| Expt B |
12 peptides |
40 spectra |
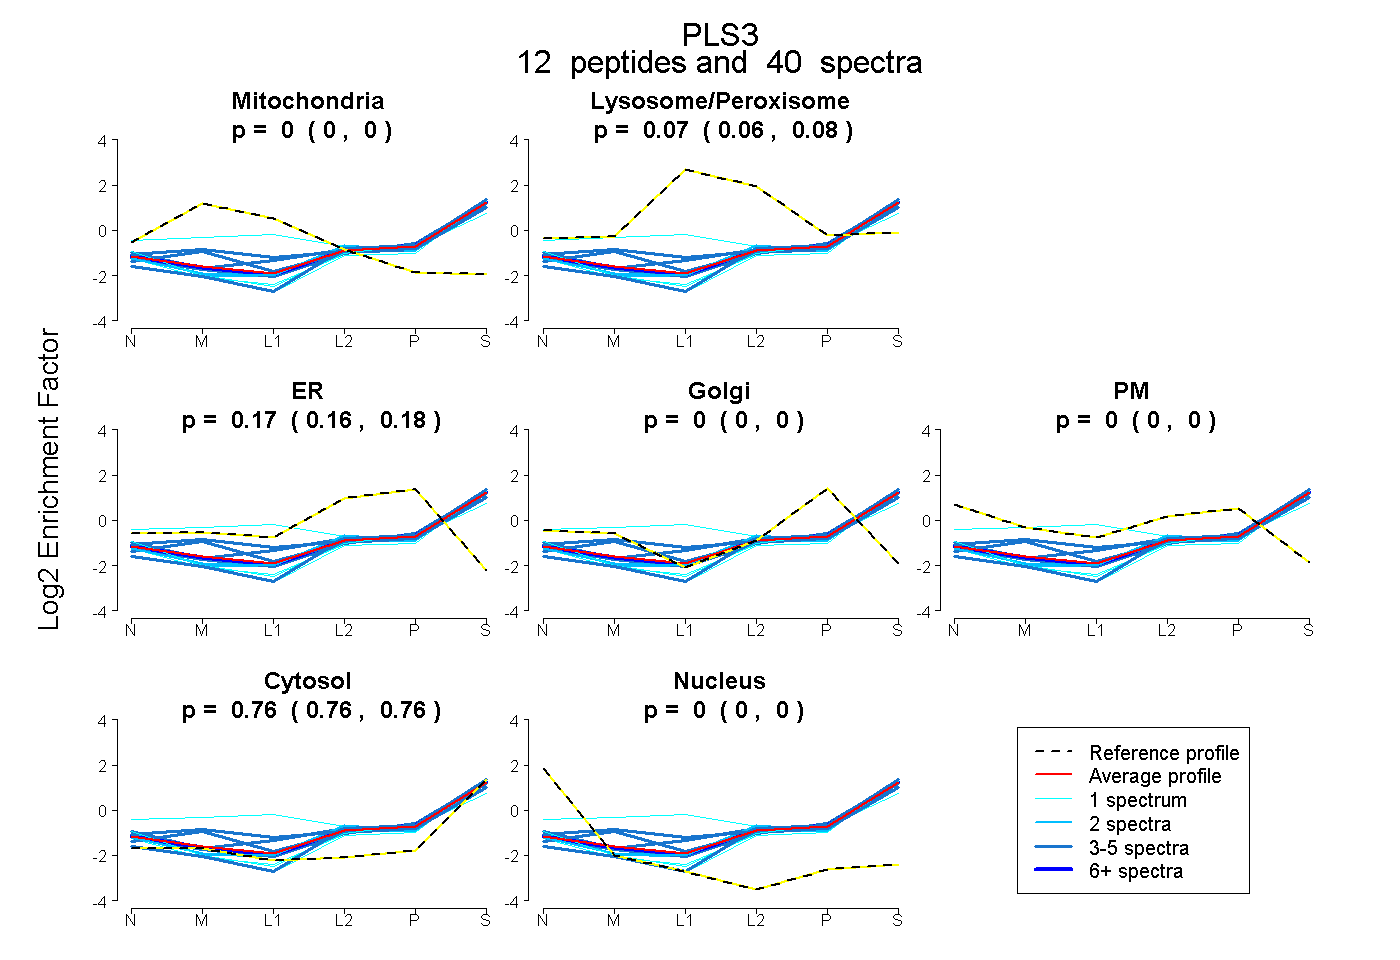 |
0.000 0.000 | 0.000 |
0.069 0.058 | 0.078 |
0.171 0.164 | 0.178 |
0.000 0.000 | 0.000 |
0.000 0.000 | 0.000 |
0.760 0.756 | 0.764 |
0.000 0.000 | 0.000 |
|||
| Plot | Lyso | Other | |||||||||||
| Expt C |
28 peptides |
167 spectra |
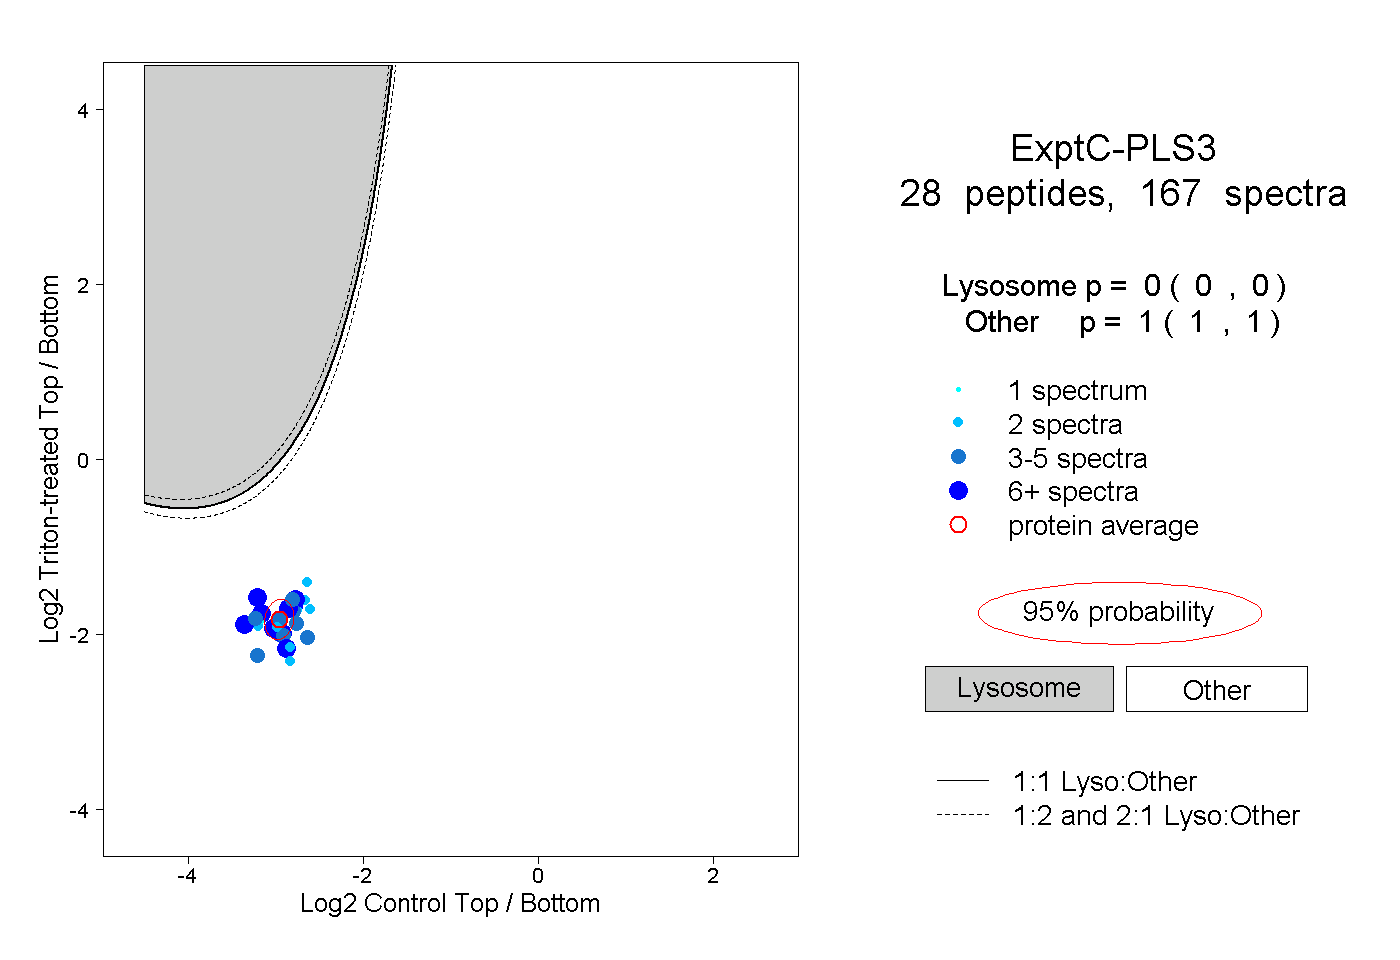 |
0.000 0.000 | 0.000 |
1.000 1.000 | 1.000 |
||||||||
| Plot | Lyso | Other | |||||||||||
| Expt D |
7 peptides |
15 spectra |
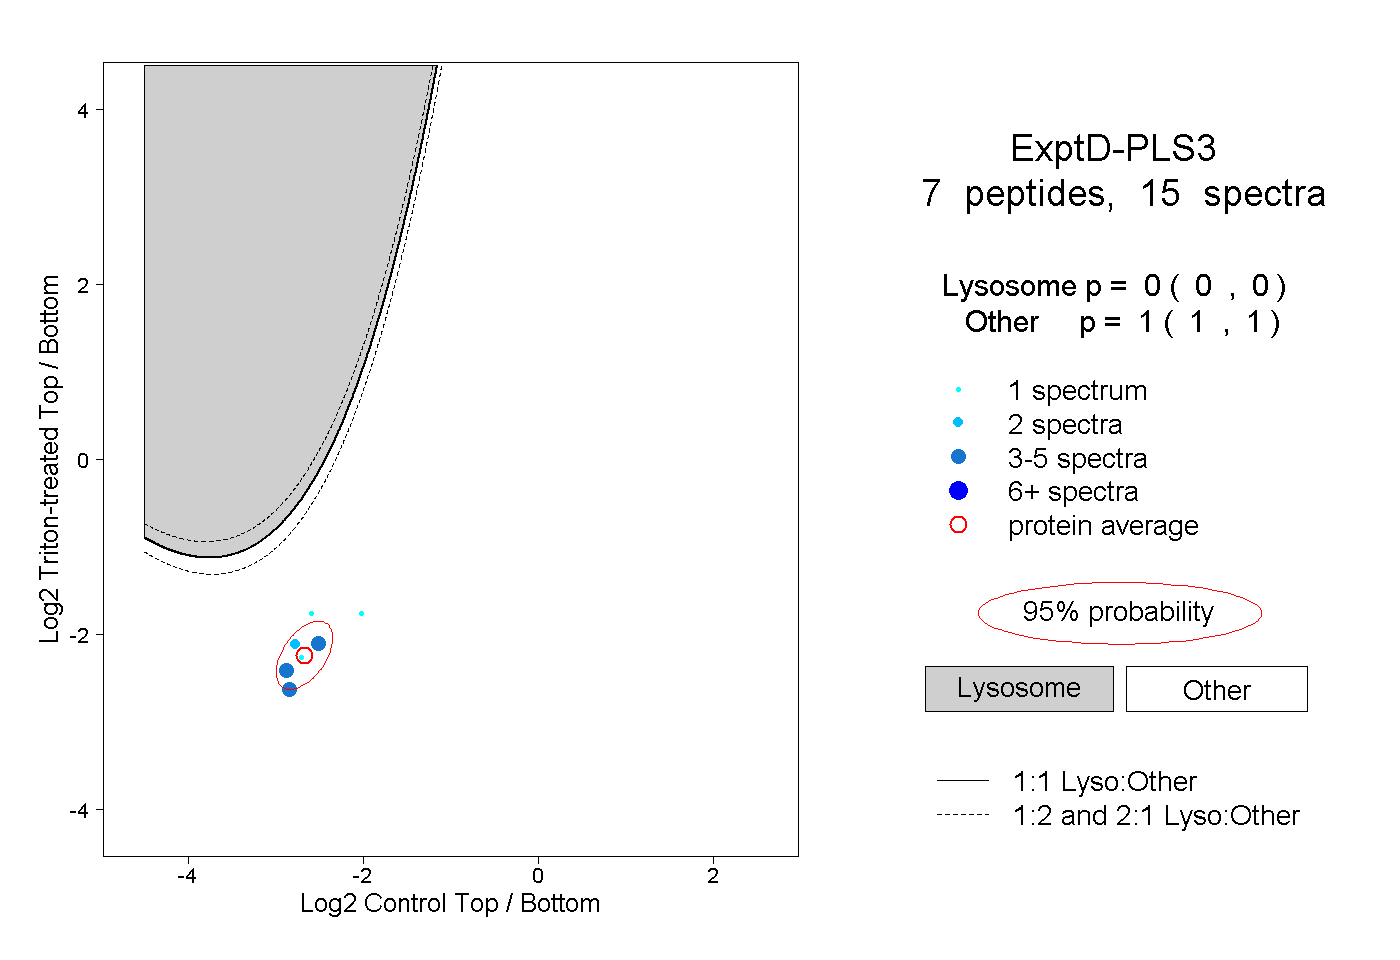 |
0.000 0.000 | 0.000 |
1.000 1.000 | 1.000 |