 6
6peptides
spectra
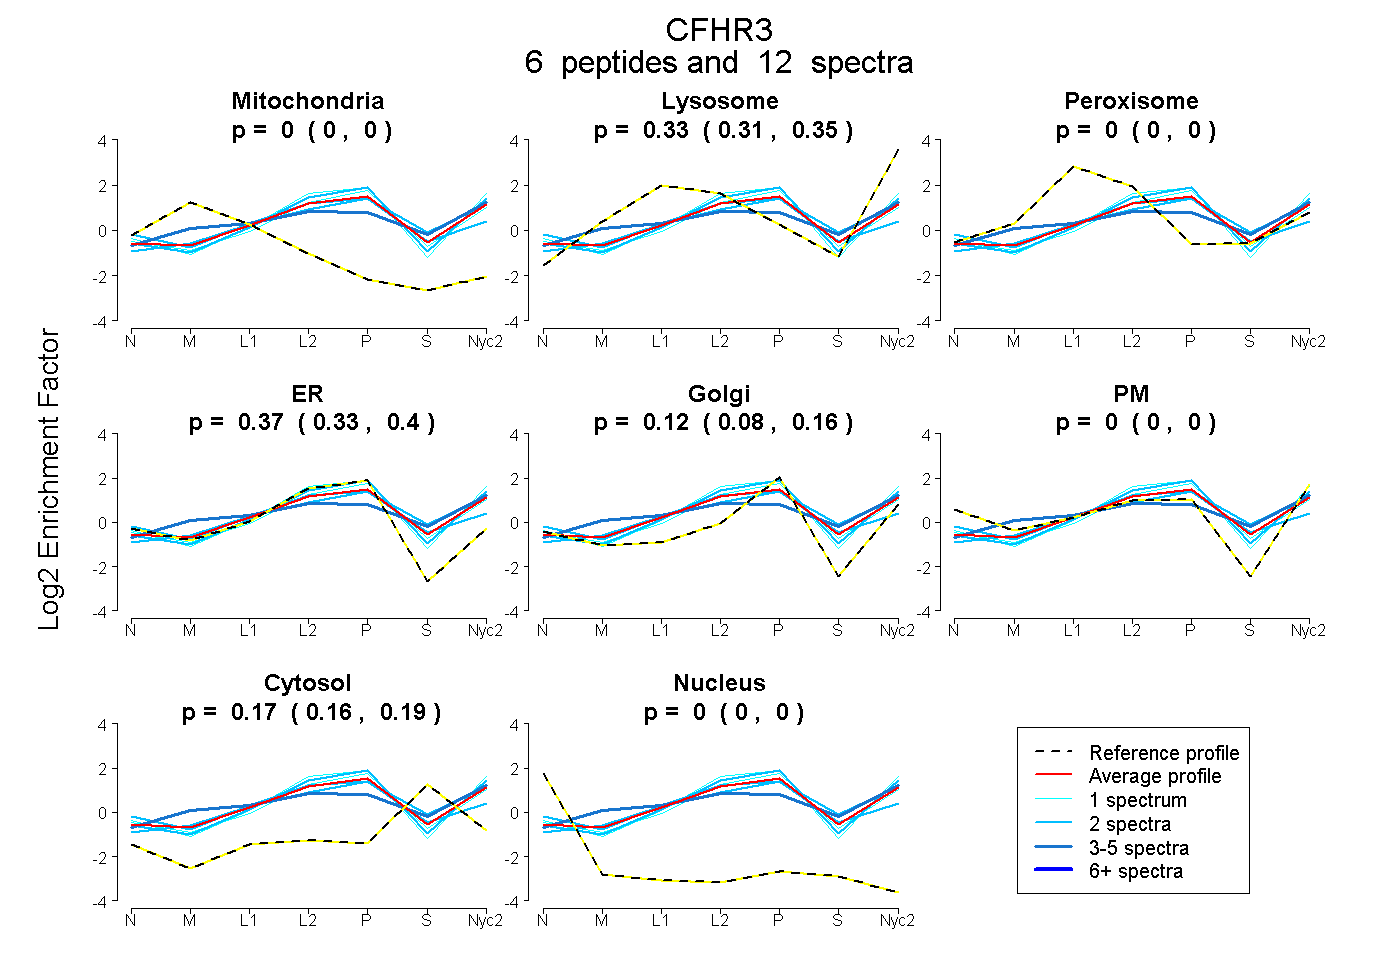
0.000 | 0.000
0.314 | 0.348
0.000 | 0.003
0.327 | 0.402
0.080 | 0.158
0.000 | 0.002
0.155 | 0.187
0.000 | 0.000
1peptide
spectra
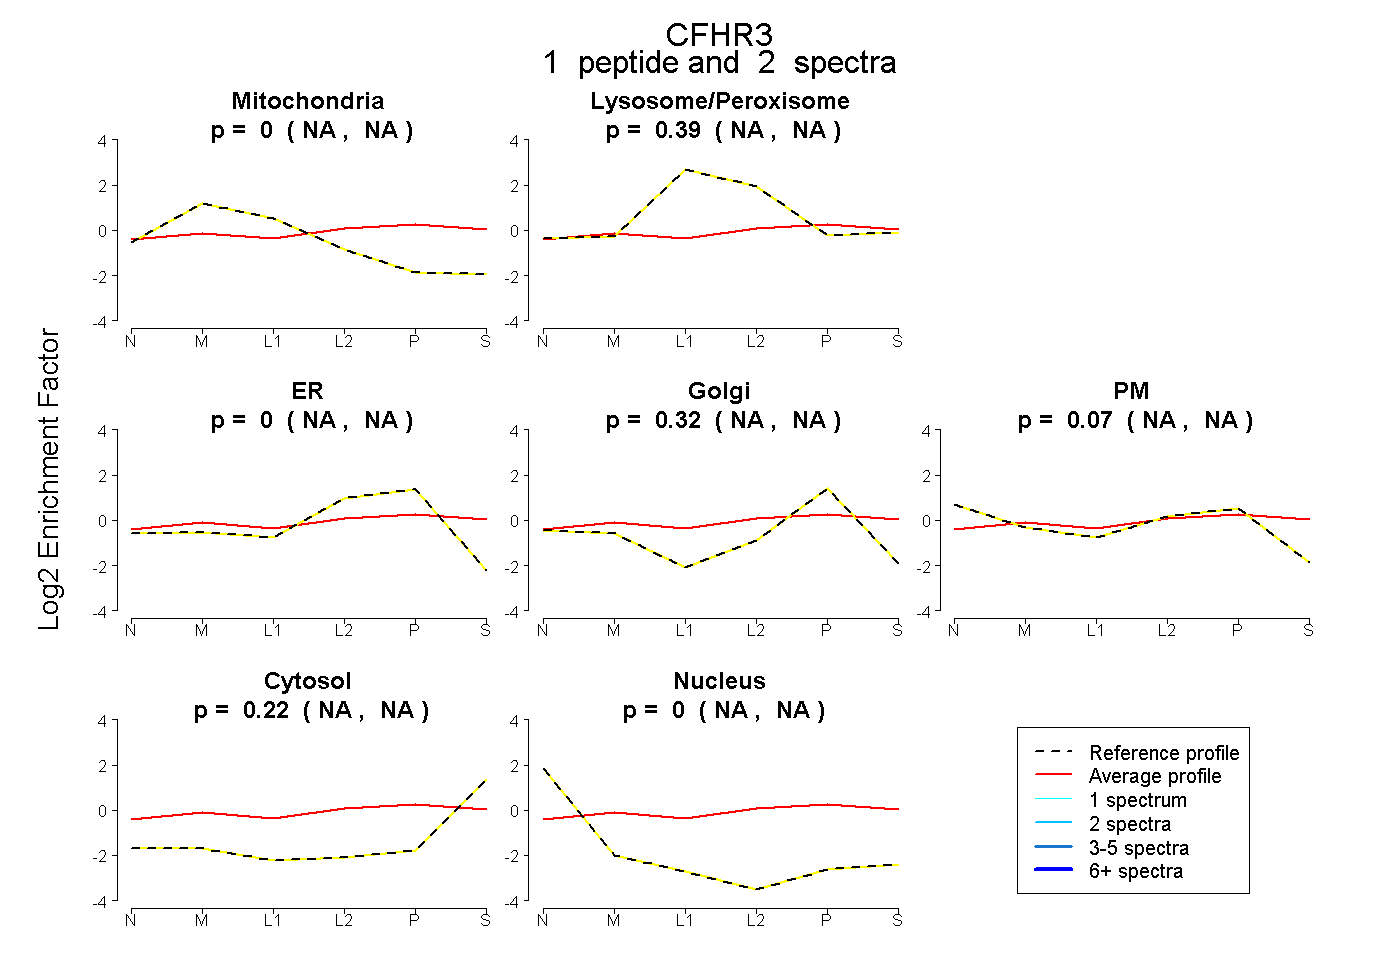
NA | NA
NA | NA
NA | NA
NA | NA
NA | NA
NA | NA
NA | NA
5peptides
spectra
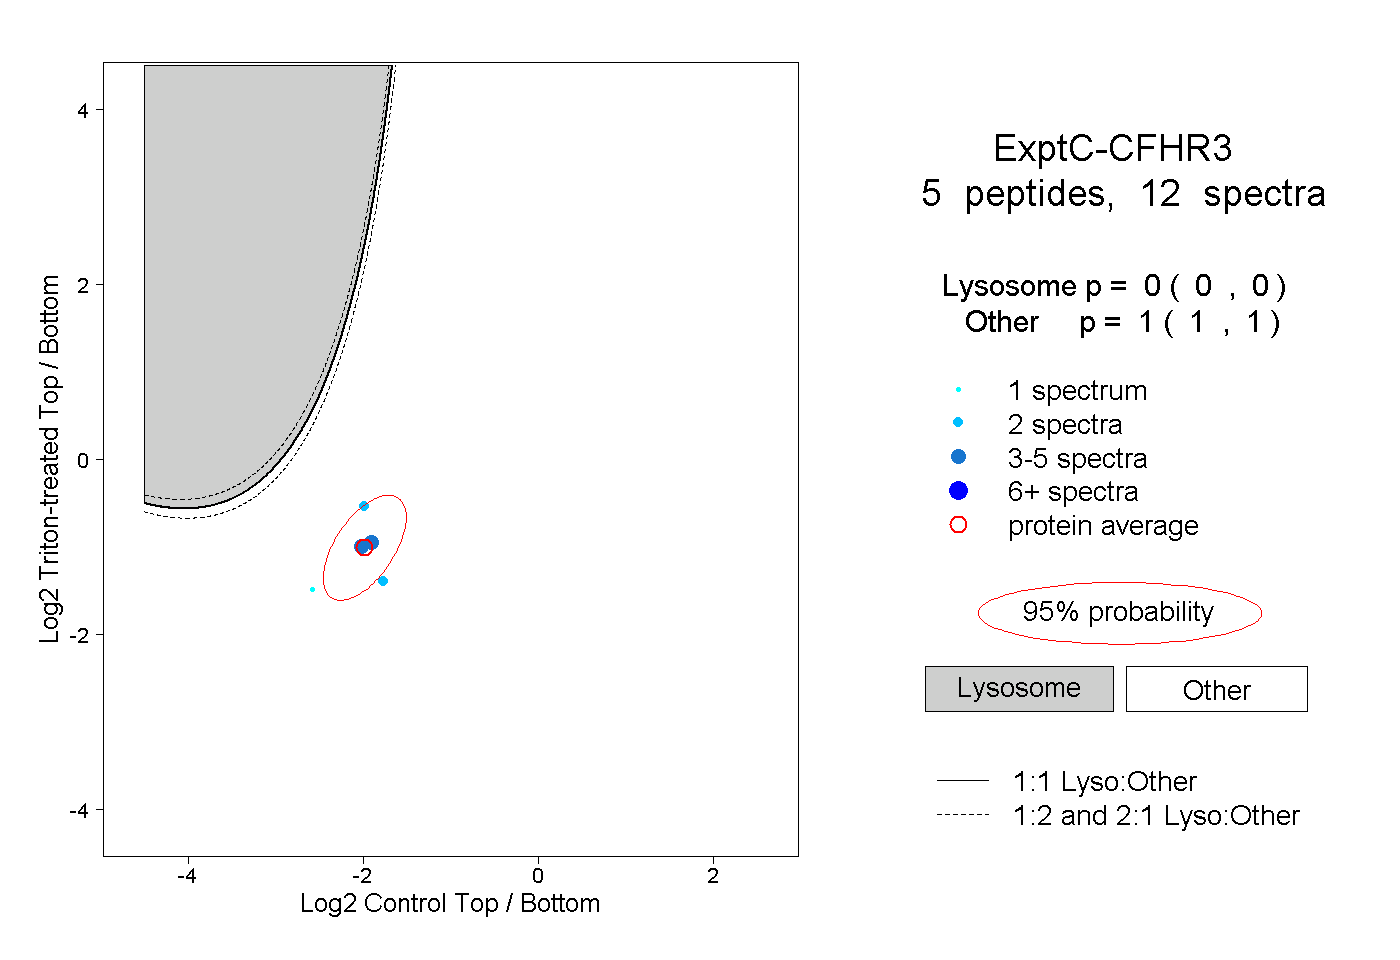
0.000 | 0.000
1.000 | 1.000