 4
4peptides
spectra
0.000 | 0.016
0.000 | 0.000
0.000 | 0.000
0.065 | 0.188
0.000 | 0.074
0.000 | 0.000
0.644 | 0.725
0.106 | 0.183
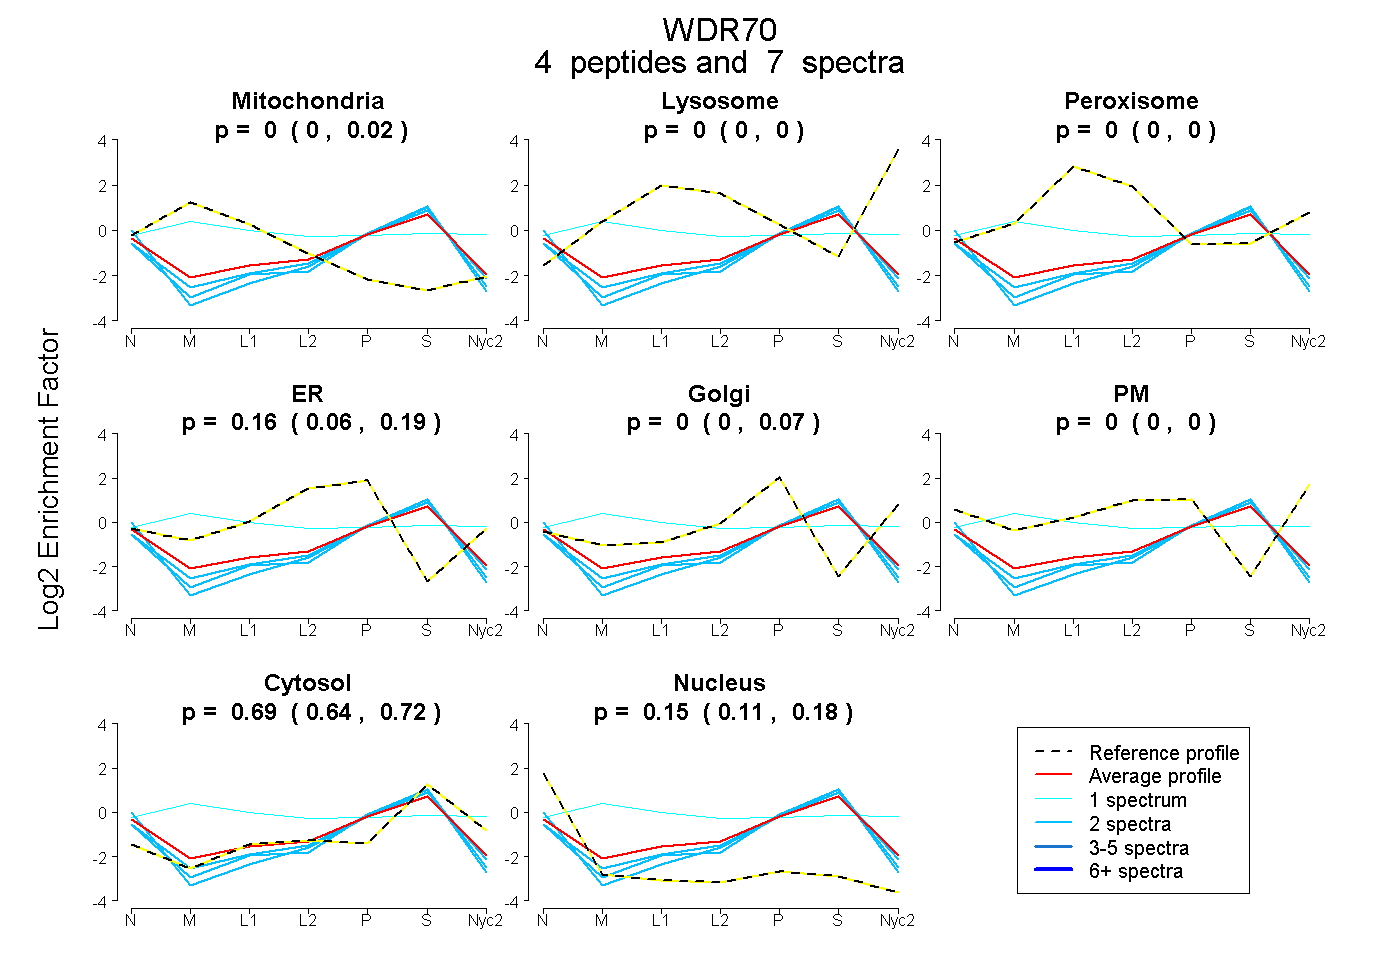
| Plot | Mito | Lyso | Perox | ER | Golgi | PM | Cytosol | Nucleus | |||||
| Expt A |
4 peptides |
7 spectra |
|
0.000 0.000 | 0.016 |
0.000 0.000 | 0.000 |
0.000 0.000 | 0.000 |
0.157 0.065 | 0.188 |
0.000 0.000 | 0.074 |
0.000 0.000 | 0.000 |
0.691 0.644 | 0.725 |
0.152 0.106 | 0.183 |
| 2 spectra, VIPTTCTYSR | 0.000 | 0.000 | 0.000 | 0.017 | 0.000 | 0.000 | 0.770 | 0.213 | ||
| 2 spectra, LIVTGTSVQR | 0.000 | 0.000 | 0.000 | 0.068 | 0.000 | 0.000 | 0.756 | 0.176 | ||
| 1 spectrum, IPDSHEITLK | 0.233 | 0.013 | 0.245 | 0.000 | 0.118 | 0.102 | 0.291 | 0.000 | ||
| 2 spectra, LVFFER | 0.000 | 0.000 | 0.000 | 0.000 | 0.041 | 0.000 | 0.720 | 0.239 |
| Plot | Lyso | Other | |||||||||||
| Expt C |
1 peptide |
1 spectrum |
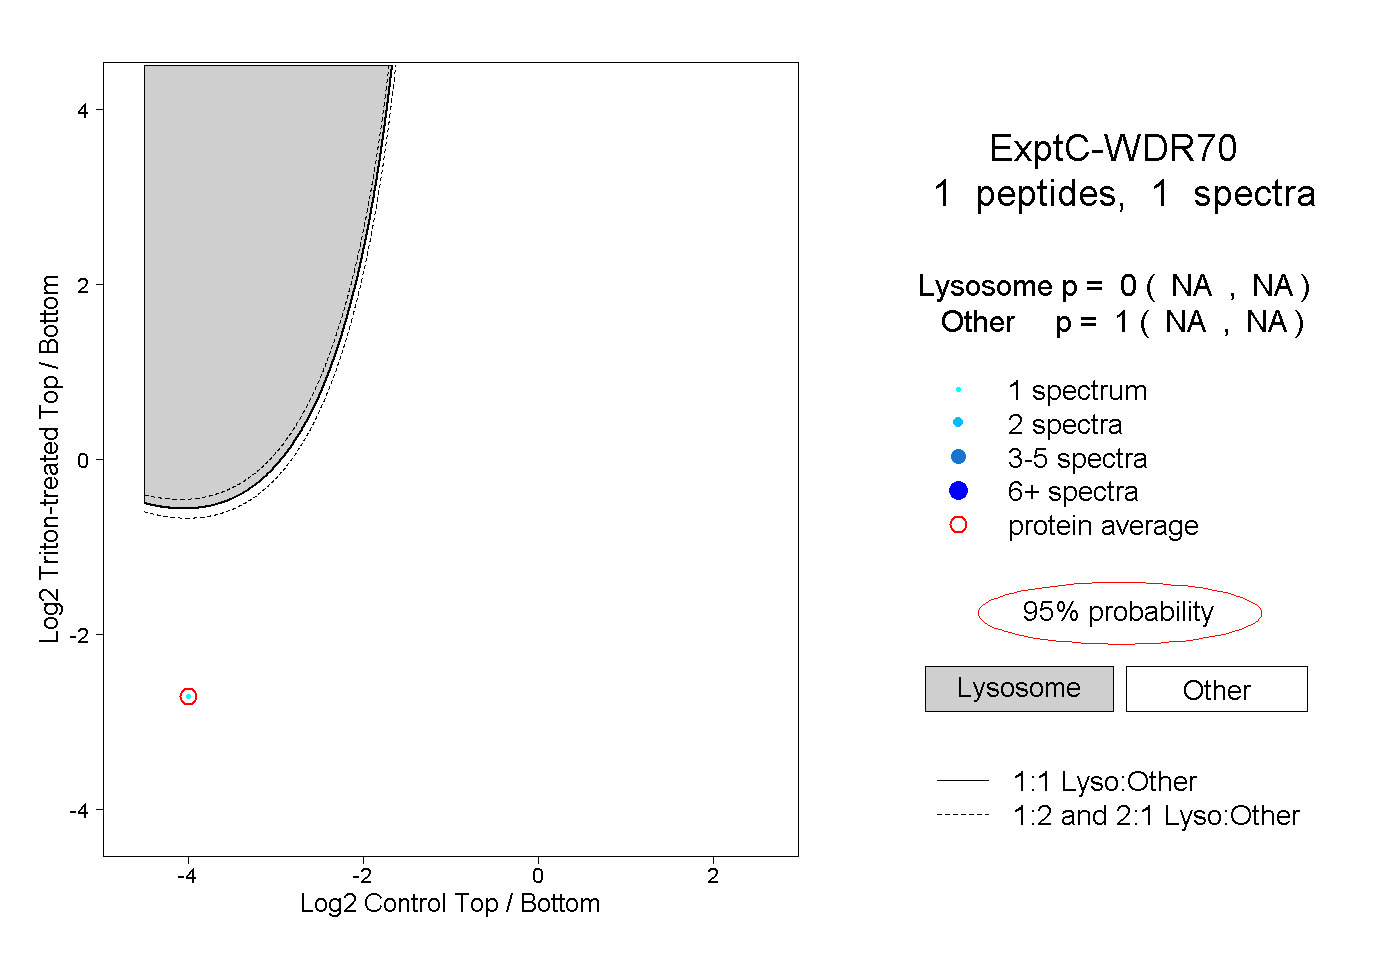 |
0.000 NA | NA |
1.000 NA | NA |