 5
5peptides
spectra
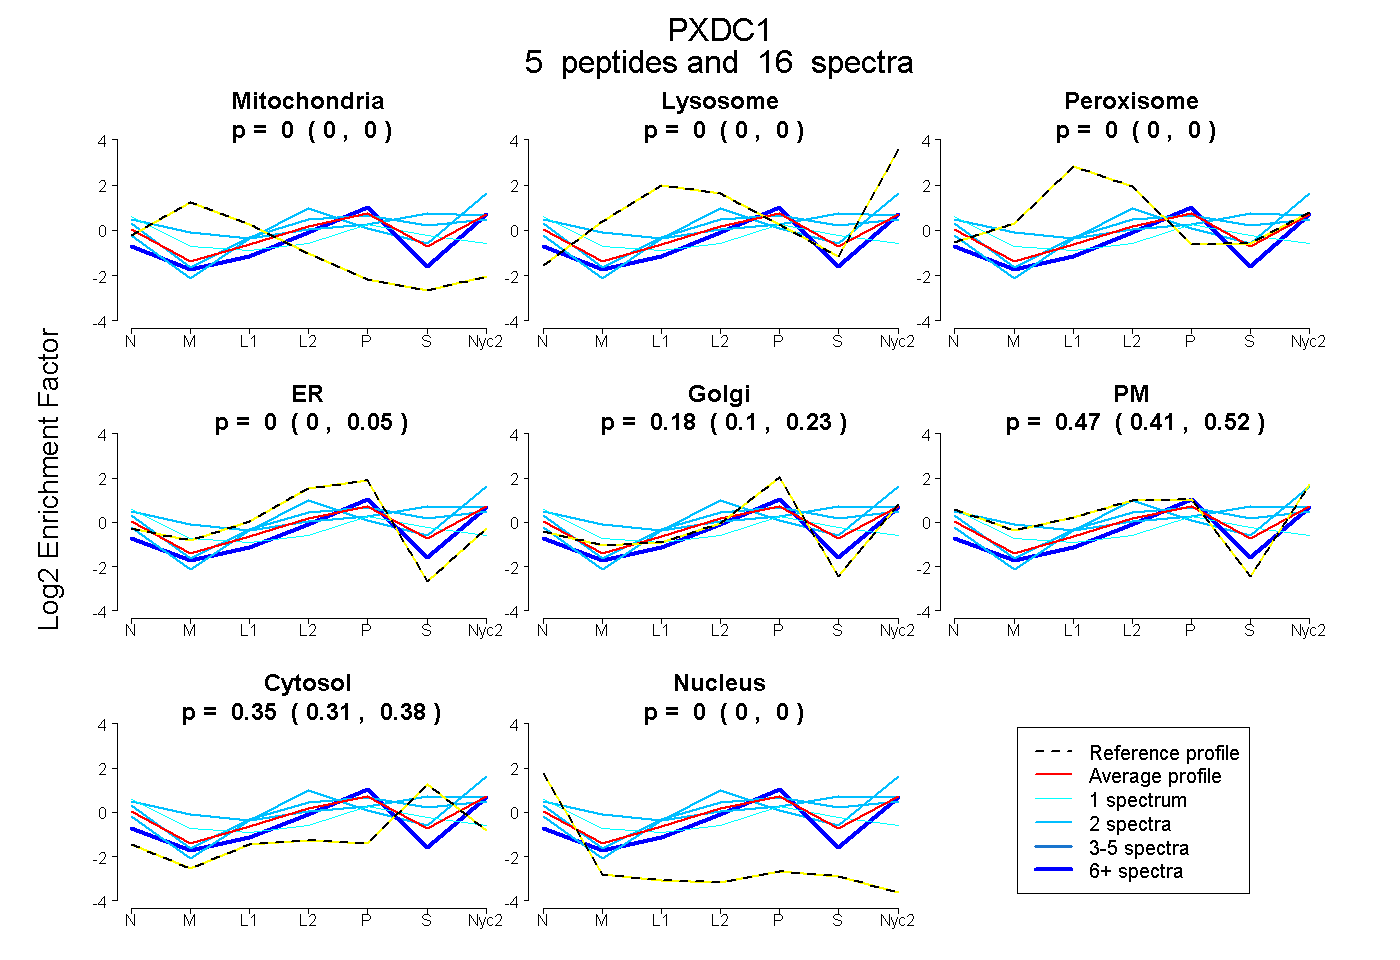
0.000 | 0.000
0.000 | 0.000
0.000 | 0.000
0.000 | 0.046
0.099 | 0.231
0.411 | 0.515
0.311 | 0.379
0.000 | 0.000
| Plot | Mito | Lyso | Perox | ER | Golgi | PM | Cytosol | Nucleus | |||||
| Expt A |
5 peptides |
16 spectra |
|
0.000 0.000 | 0.000 |
0.000 0.000 | 0.000 |
0.000 0.000 | 0.000 |
0.000 0.000 | 0.046 |
0.178 0.099 | 0.231 |
0.473 0.411 | 0.515 |
0.349 0.311 | 0.379 |
0.000 0.000 | 0.000 |
| 9 spectra, LIVSR | 0.000 | 0.019 | 0.000 | 0.000 | 0.709 | 0.020 | 0.252 | 0.000 | ||
| 2 spectra, SFADLGR | 0.000 | 0.086 | 0.018 | 0.000 | 0.000 | 0.320 | 0.575 | 0.000 | ||
| 1 spectrum, SVLYLHR | 0.071 | 0.000 | 0.000 | 0.075 | 0.036 | 0.338 | 0.396 | 0.084 | ||
| 2 spectra, SEVVLTFFER | 0.000 | 0.000 | 0.058 | 0.064 | 0.000 | 0.445 | 0.434 | 0.000 | ||
| 2 spectra, GAHDIETR | 0.000 | 0.125 | 0.060 | 0.000 | 0.000 | 0.593 | 0.221 | 0.000 |
| Plot | Lyso | Other | |||||||||||
| Expt C |
3 peptides |
9 spectra |
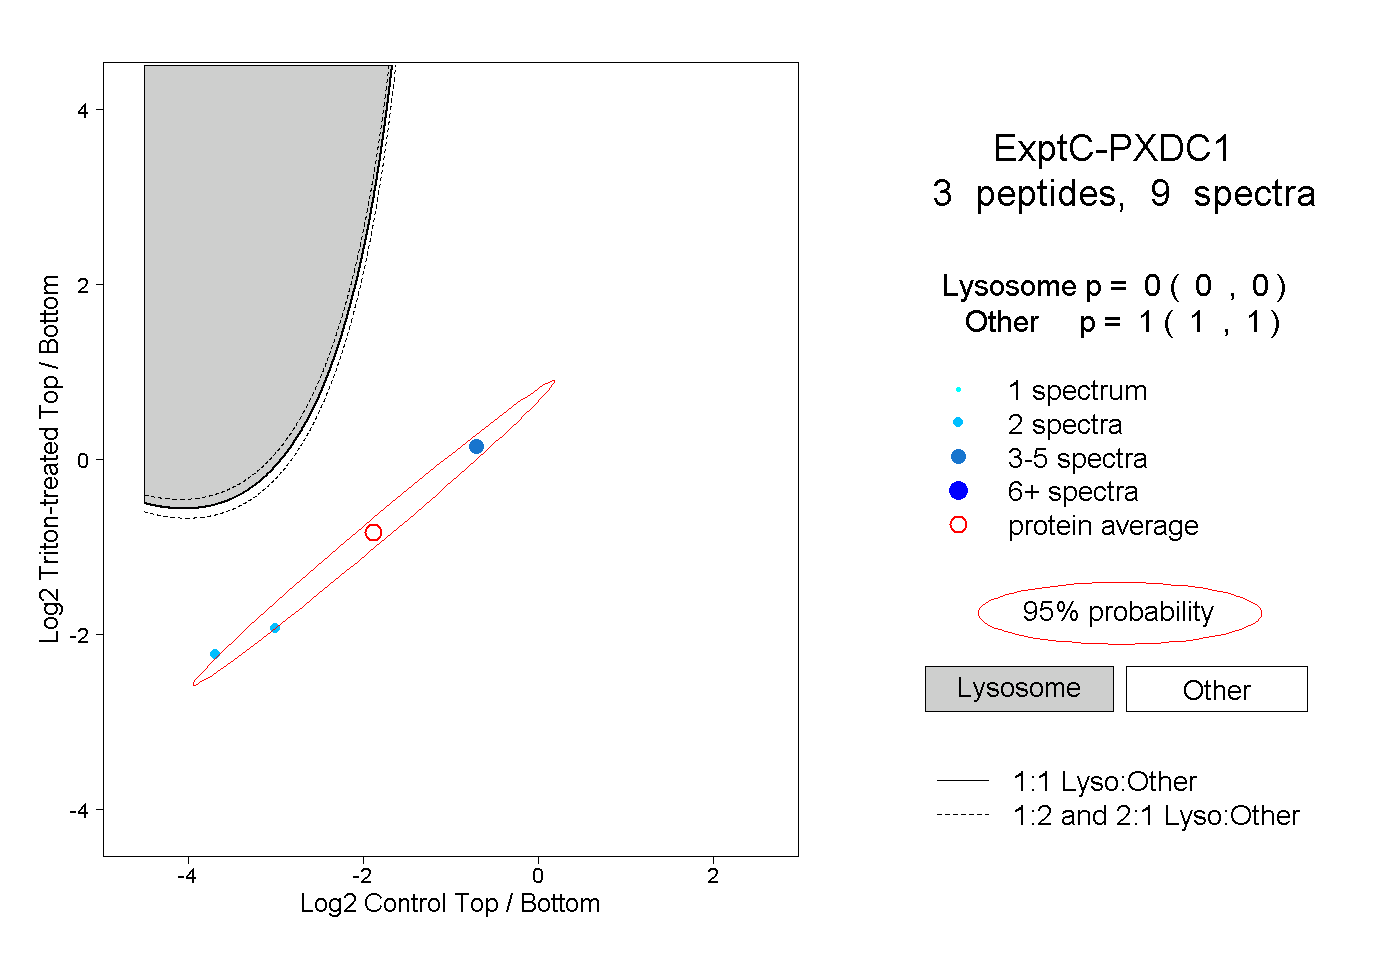 |
0.000 0.000 | 0.000 |
1.000 1.000 | 1.000 |