12
12peptides
spectra
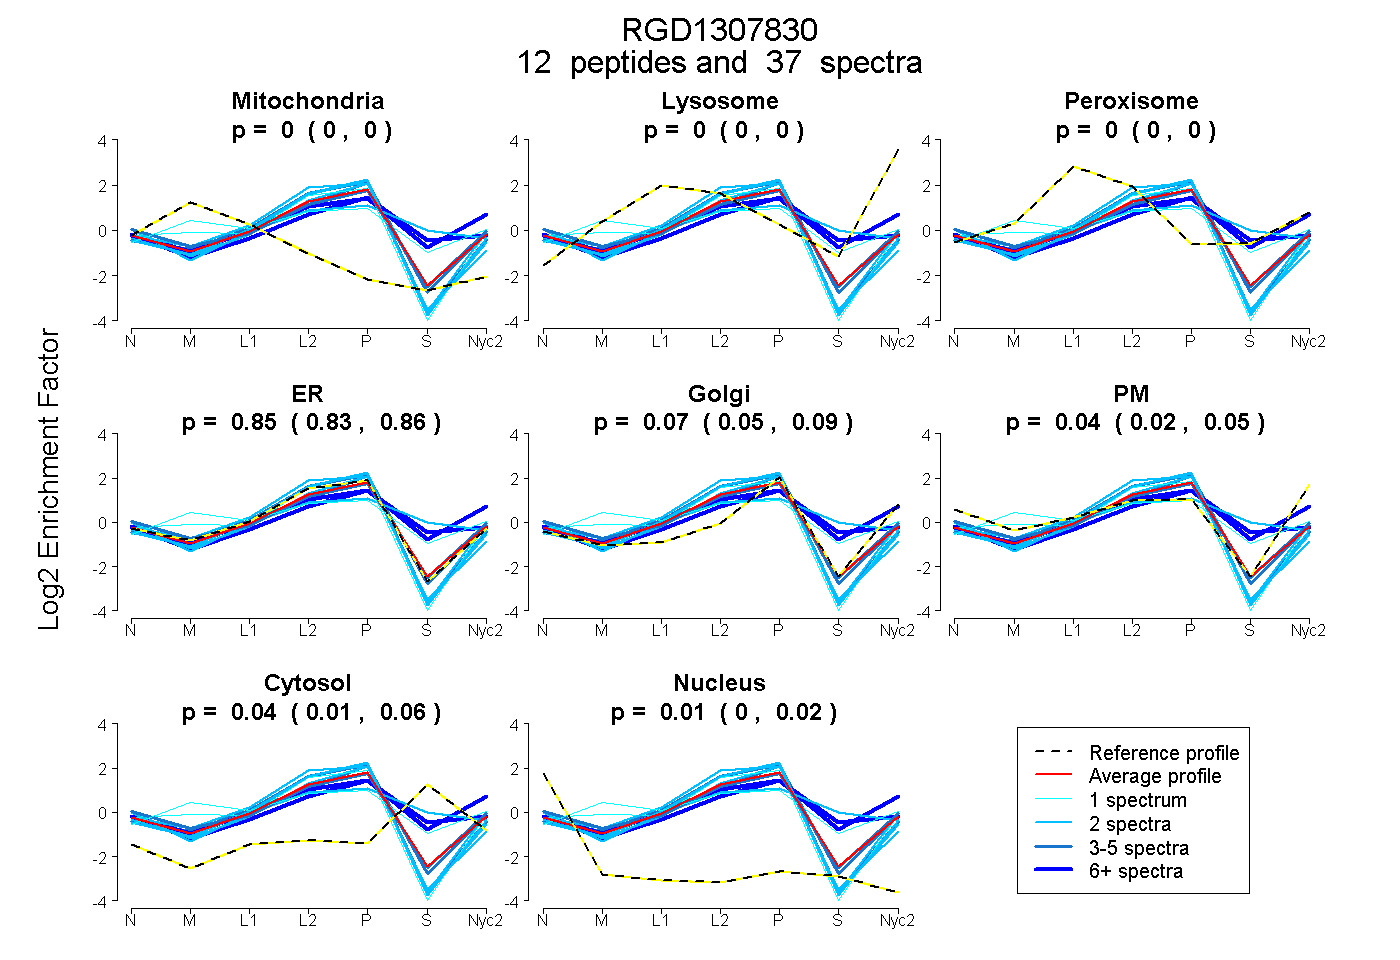
0.000 | 0.000
0.000 | 0.000
0.000 | 0.002
0.826 | 0.863
0.048 | 0.092
0.019 | 0.051
0.012 | 0.057
0.000 | 0.016
8peptides
spectra
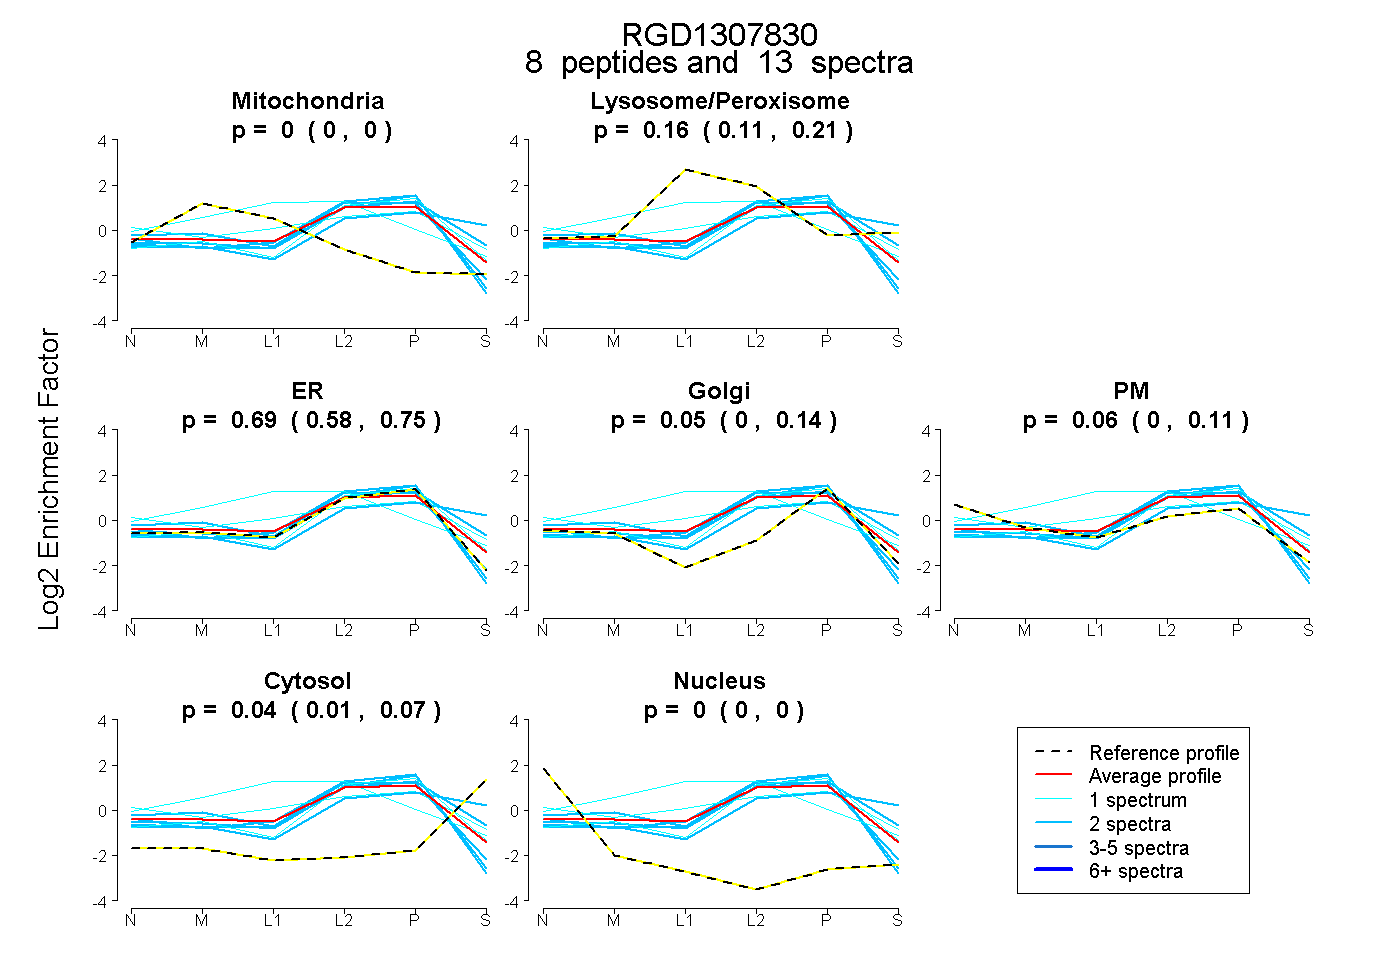
0.000 | 0.000
0.105 | 0.212
0.580 | 0.754
0.000 | 0.145
0.000 | 0.108
0.008 | 0.069
0.000 | 0.000