 12
12peptides
spectra
0.000 | 0.000
0.000 | 0.000
0.000 | 0.002
0.826 | 0.863
0.048 | 0.092
0.019 | 0.051
0.012 | 0.057
0.000 | 0.016
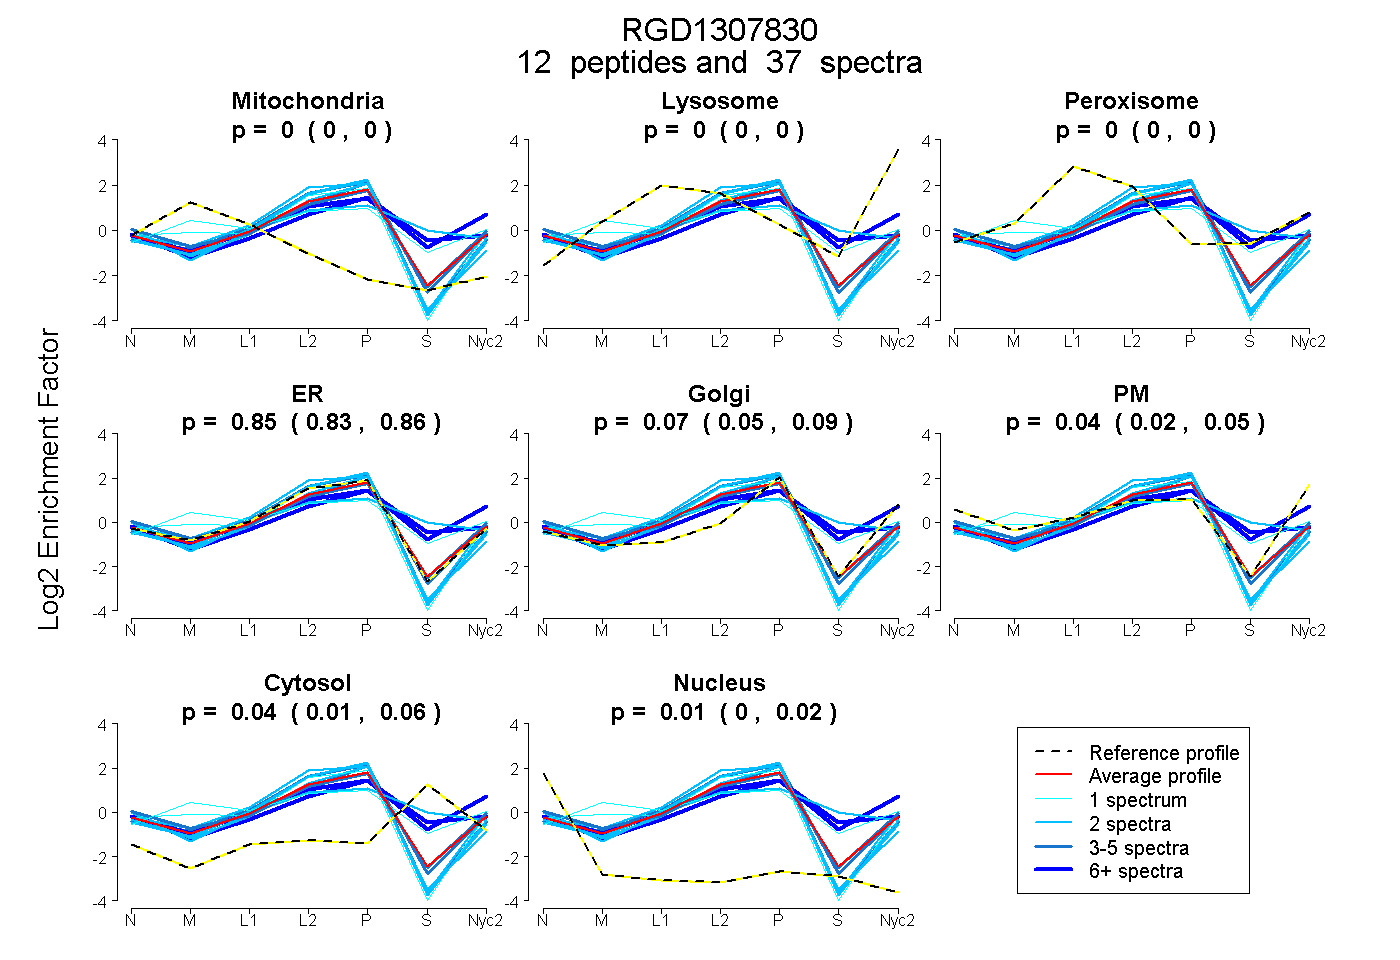
| Plot | Mito | Lyso | Perox | ER | Golgi | PM | Cytosol | Nucleus | |||||
| Expt A |
12 peptides |
37 spectra |
|
0.000 0.000 | 0.000 |
0.000 0.000 | 0.000 |
0.000 0.000 | 0.002 |
0.847 0.826 | 0.863 |
0.072 0.048 | 0.092 |
0.037 0.019 | 0.051 |
0.039 0.012 | 0.057 |
0.005 0.000 | 0.016 |
| 1 spectrum, VLTQLLLNSDHR | 0.090 | 0.001 | 0.310 | 0.203 | 0.319 | 0.000 | 0.077 | 0.000 | ||
| 2 spectra, LIFSMEK | 0.000 | 0.000 | 0.000 | 1.000 | 0.000 | 0.000 | 0.000 | 0.000 | ||
| 2 spectra, FGDESAEEIR | 0.000 | 0.000 | 0.000 | 1.000 | 0.000 | 0.000 | 0.000 | 0.000 | ||
| 4 spectra, DILNTVADR | 0.000 | 0.000 | 0.000 | 1.000 | 0.000 | 0.000 | 0.000 | 0.000 | ||
| 2 spectra, GNTQAAAHSFDVR | 0.000 | 0.000 | 0.152 | 0.498 | 0.000 | 0.000 | 0.351 | 0.000 | ||
| 9 spectra, DAVQAVK | 0.000 | 0.000 | 0.072 | 0.508 | 0.124 | 0.000 | 0.296 | 0.000 | ||
| 6 spectra, GNDCDLLEGQK | 0.000 | 0.154 | 0.000 | 0.416 | 0.043 | 0.177 | 0.210 | 0.000 | ||
| 2 spectra, DYVILATR | 0.000 | 0.000 | 0.000 | 0.935 | 0.000 | 0.000 | 0.000 | 0.065 | ||
| 2 spectra, LWNVTEDEVSER | 0.000 | 0.000 | 0.000 | 0.989 | 0.000 | 0.011 | 0.000 | 0.000 | ||
| 3 spectra, AYIHSNRPK | 0.000 | 0.000 | 0.000 | 0.806 | 0.194 | 0.000 | 0.000 | 0.000 | ||
| 3 spectra, NYELPQR | 0.000 | 0.000 | 0.000 | 0.735 | 0.086 | 0.146 | 0.000 | 0.033 | ||
| 1 spectrum, LDNLDEEWATEHANQVSR | 0.038 | 0.000 | 0.000 | 0.902 | 0.000 | 0.060 | 0.000 | 0.000 |
| Plot | Mito | Lyso or Perox | ER | Golgi | PM | Cytosol | Nucleus | ||||||
| Expt B |
8 peptides |
13 spectra |
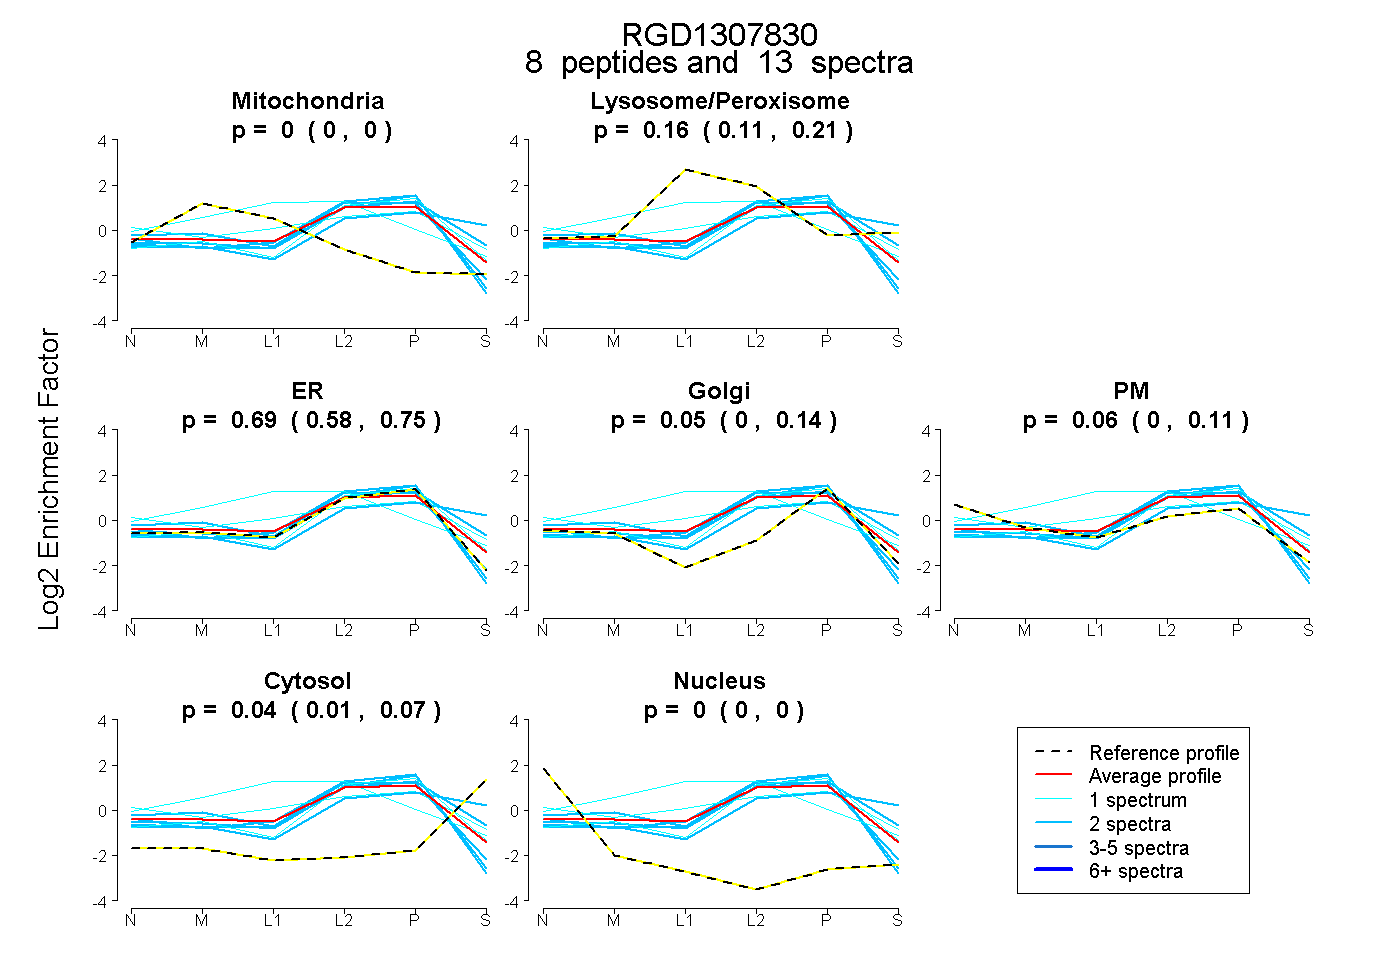 |
0.000 0.000 | 0.000 |
0.159 0.105 | 0.212 |
0.687 0.580 | 0.754 |
0.053 0.000 | 0.145 |
0.057 0.000 | 0.108 |
0.043 0.008 | 0.069 |
0.000 0.000 | 0.000 |
|||
| Plot | Lyso | Other | |||||||||||
| Expt C |
14 peptides |
50 spectra |
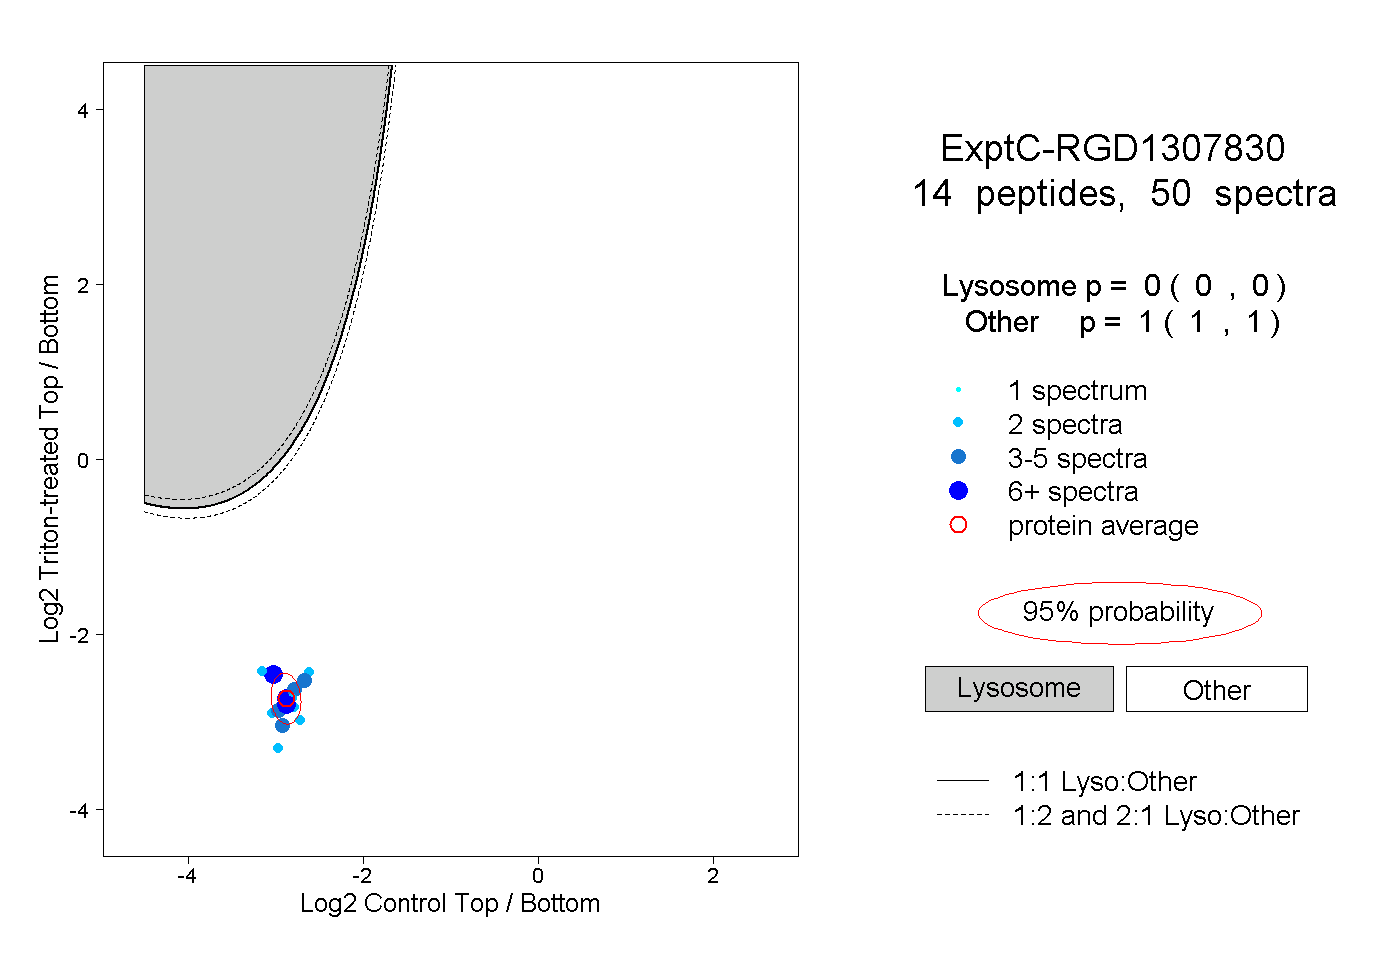 |
0.000 0.000 | 0.000 |
1.000 1.000 | 1.000 |
||||||||
| Plot | Lyso | Other | |||||||||||
| Expt D |
2 peptides |
4 spectra |
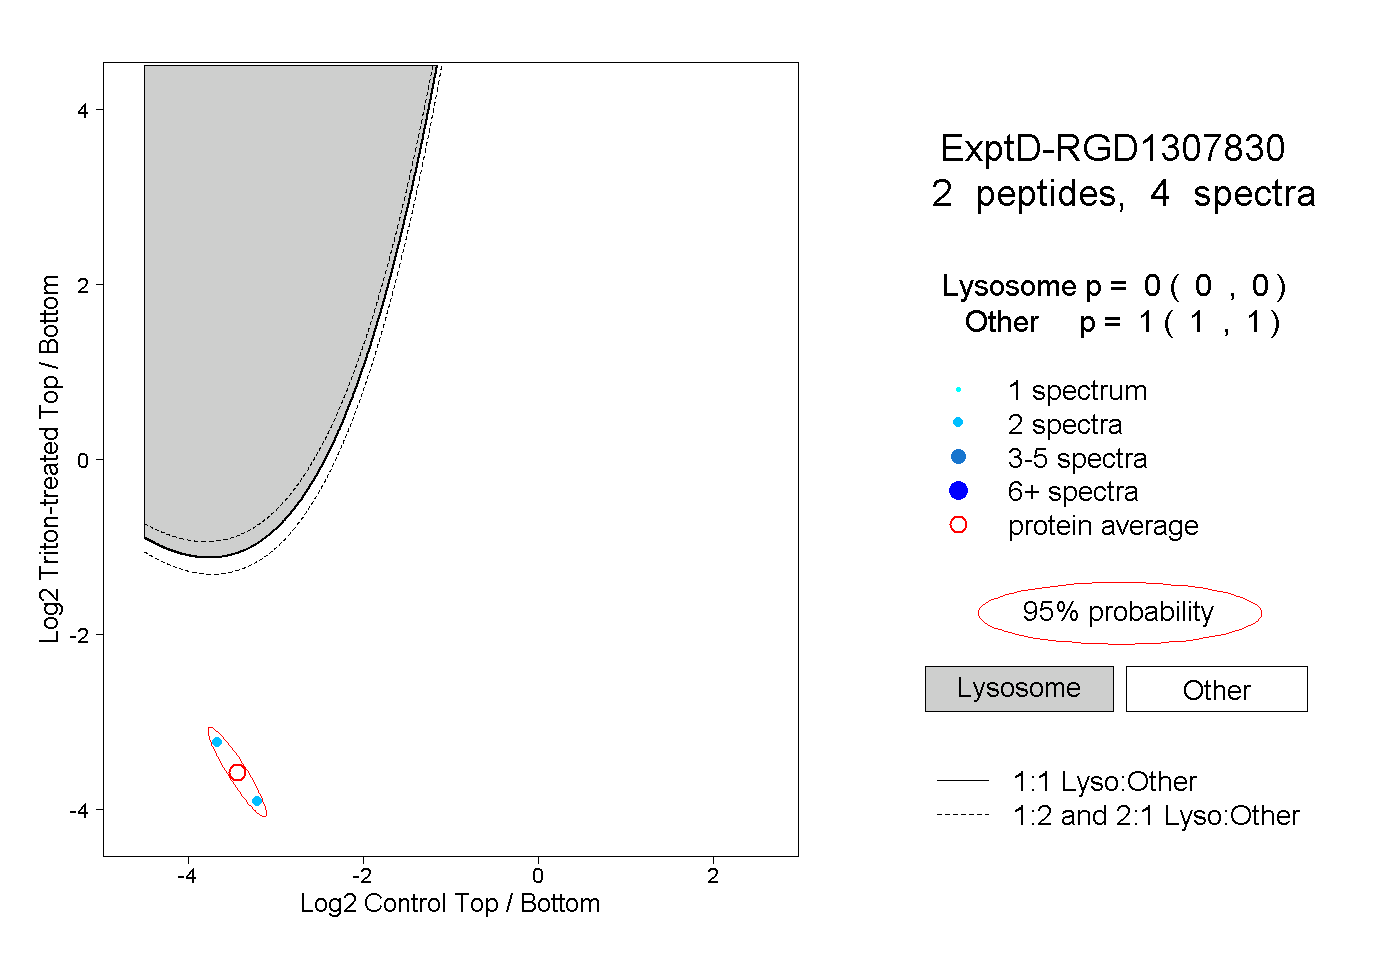 |
0.000 0.000 | 0.000 |
1.000 1.000 | 1.000 |